Join Our Telegram channel to stay up to date on breaking news coverage
LTC Price Prediction – November 16
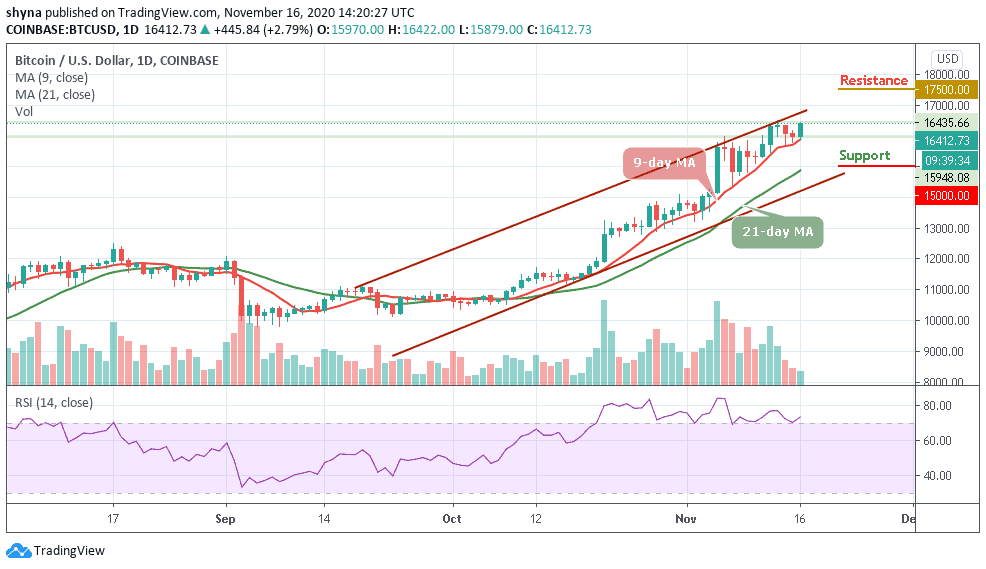
Litecoin adds 15.57% in a day, and it is now being traded around $72.08. The next major resistance is likely to come at $75.
LTC/USD Market
Key Levels:
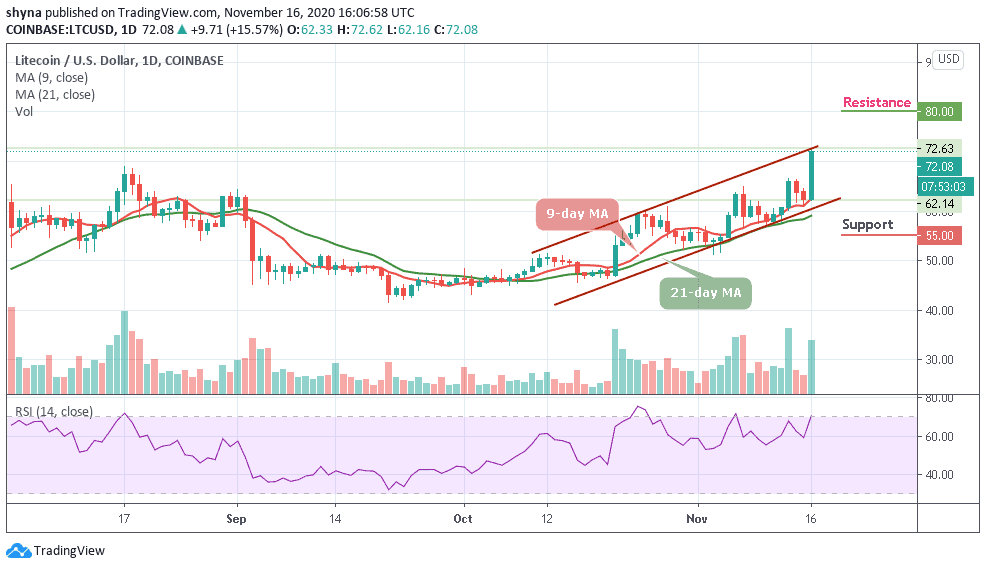
Resistance levels: $80, $82, $84
Support levels: $55, $53, $51
LTC/USD has been able to fetch a decent hike in the last 24 hours that took the coin near the $73 resistance level. The coin is already on a path of a bullish trend. Meanwhile, LTC is one of the most emerging coins of the market, and it is likely to touch $75 in the coming days as its next resistance as the long-term outlook remains bullish.
Where is LTC Price Going Next?
As the trading volume is increasing, the coin is moving within the ascending channel and could exceed the resistance levels of $80, $82, and $84 if the bulls make more effort. Nevertheless, the RSI (14) is crossing into the overbought territory but the bears may step back into the market if the signal line turns downward and the nearest support levels lie at $55, $53, and $51 respectively.
However, the technical indicator RSI (14) confirms the bullish opinion of the above analysis in the very short term. Nevertheless, traders need to be careful of excessive bullish movements. So, it is appropriate for traders to continue to watch any excessive bullish movements which may lead to a small bearish correction in the nearest term.
When compares with Bitcoin, the daily chart reveals that the buyers are dominating the market with a heavy upsurge as the price moves above the 9-day and 21-day moving averages. Meanwhile, if the bulls can continue to put more effort into the price to break out of the ascending channel, the key resistance levels lie at 0.0046 BTC and 0.0047 BTC. A further rise may push the price to 0.0048 BTC.
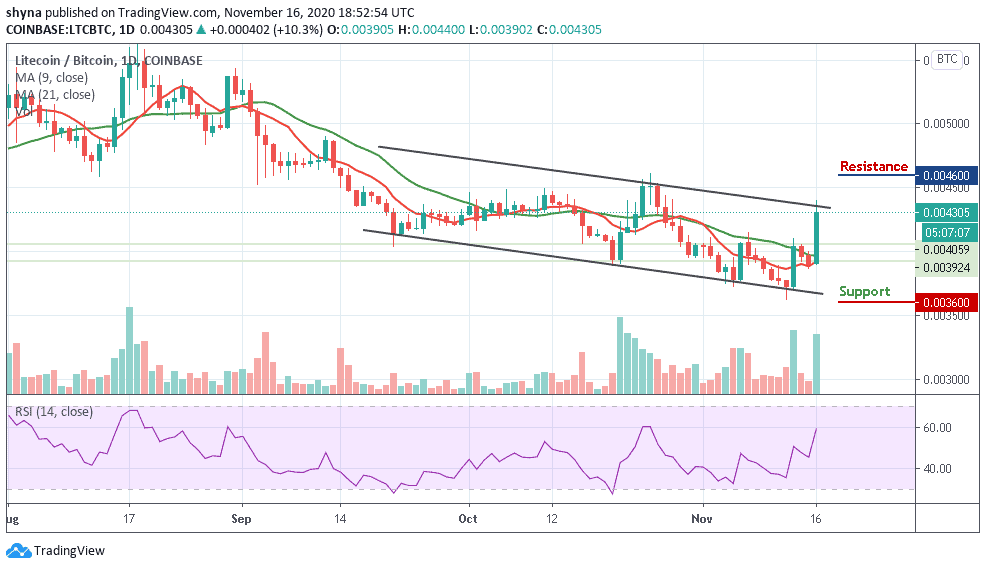
Moreover, for a reversed move, the 0.0040 BTC support is likely to resurface and if the 0.0038 BTC could not hold the reversal, the price may further drop to 0.0036 BTC, 0.0035 BTC, and 0.0034 BTC support levels. The RSI (14) keeps moving towards the north and could increase the bearish signals.
Join Our Telegram channel to stay up to date on breaking news coverage