Join Our Telegram channel to stay up to date on breaking news coverage
Bitcoin (BTC) Price Prediction – November 16
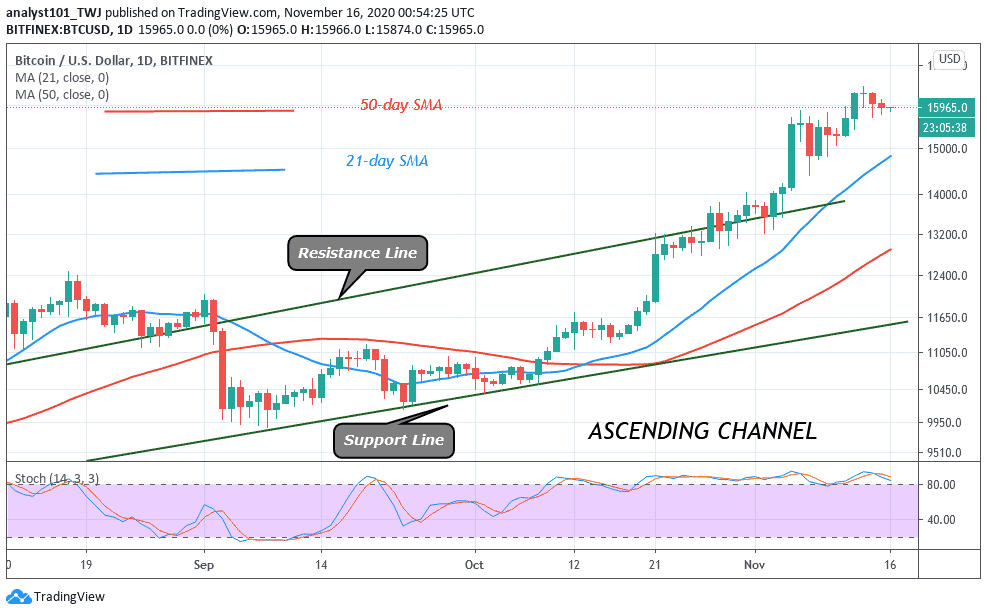
The Bitcoin price has overtaken the $16,000 price tag after struggling to remain above it during the weekend.
BTC/USD Long-term Trend: Bullish (Daily Chart)
Key levels:
Resistance Levels: $17,500, $17,700, $17,900
Support Levels: $15,000, $14,800, $14,600
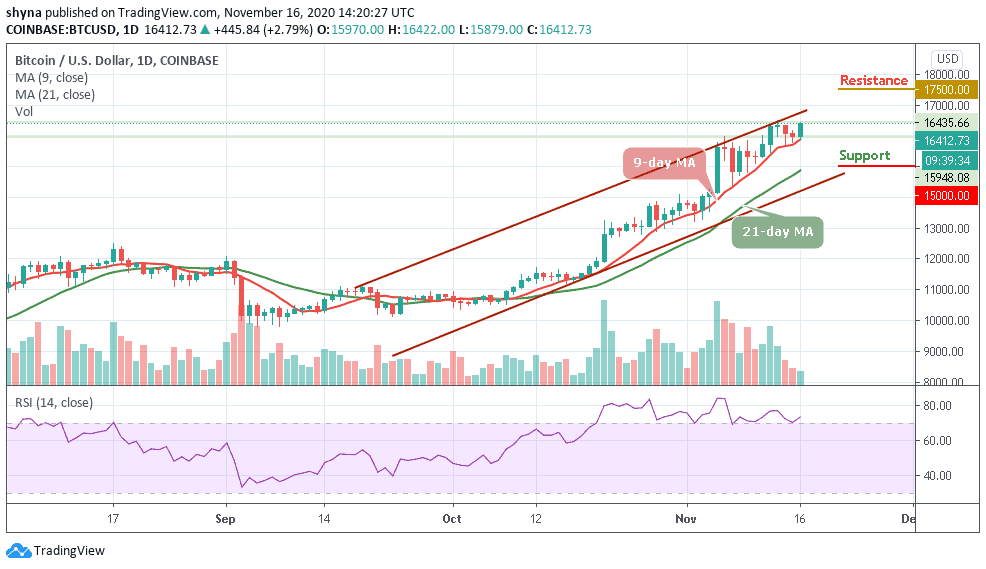
Today, BTC/USD is making a surprising move as the coin touches the daily high of $16,447. The first digital asset is cruising above the 9-day and 21-day moving averages. Looking at the past daily charts, we can clearly see that the current bullish movements started upon breaking the resistance level of $16,200 after the market experiences the bearish movements for two days.
Will BTC Break Through $16,500 Level or Reverse?
As the technical indicator RSI (14) remains within the overbought condition, the Bitcoin price is currently surpassing a critical ascending trend-line together with the horizontal resistance at $16,412. Any further bullish movement above it may fuel the continuation of the bullish movement towards the $16,800 and the psychological level of $17,200.
Moreover, the potential resistance lies at $17,500; the latter is followed by the $17,700, and $17,900 resistance levels. Meanwhile, in case of a correction, the current resistance level could serve as support. Any bearish movement below the 9-day moving average could lead to the supports at $15,000, $14,800, and $14,600.
BTC/USD Medium-Term Trend: Bullish (4H Chart)
On the 4-hour chart, BTC/USD touches a high of $16,447 after the price breaks above the 9-day and 21-day moving averages. However, as the technical indicator RSI (14) moves above the 60-level, the upward move may continue to face the resistance above the recent high.
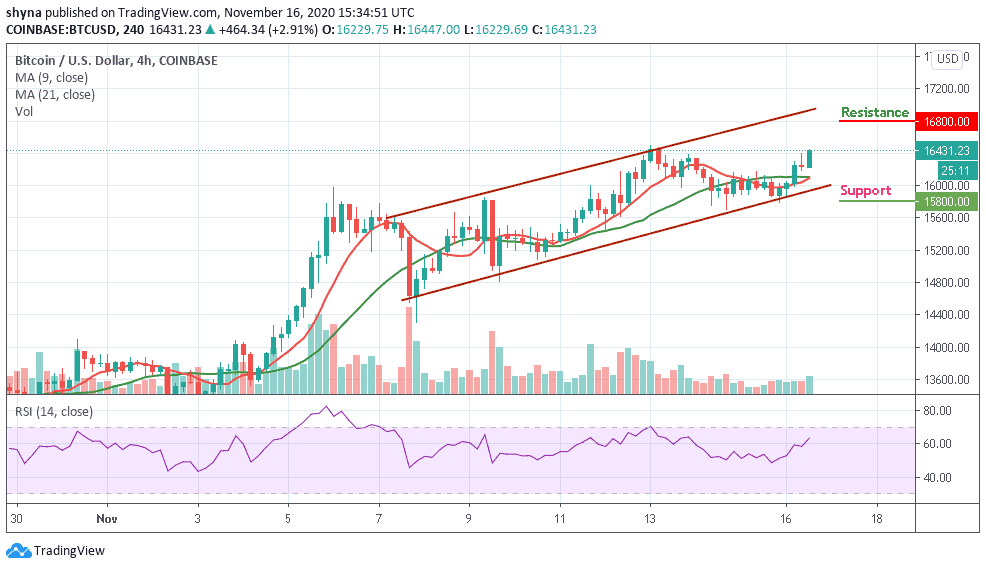
Meanwhile, on the downside, if the market price retraces and breaks below the moving averages within the ascending channel, the coin may further depreciate to the support of $15,800 and below. In other words, if the price retraces and finds another resistance near the channel, the uptrend could resume into the previous highs to hit the resistance at $16,800 and above.
Join Our Telegram channel to stay up to date on breaking news coverage