Join Our Telegram channel to stay up to date on breaking news coverage
LTC Price Prediction – November 26
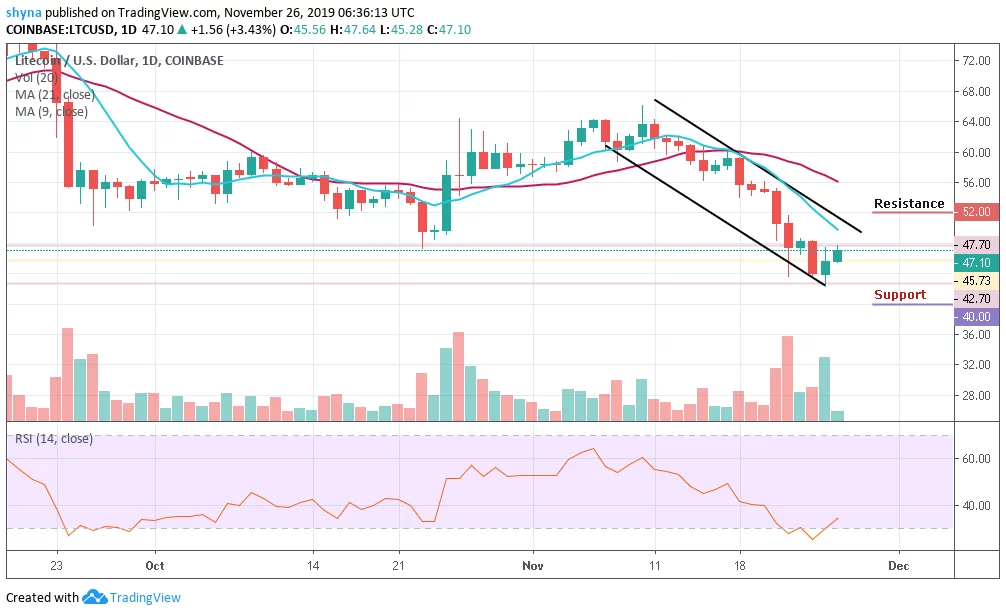
Litecoin (LTC) gains 3.43% in the last 24 hours to touch $47.70. It may find the next resistance at $48.35.
LTC/USD Market
Key Levels:
Resistance levels: $52, $54, $56
Support levels: $40, $38, $36
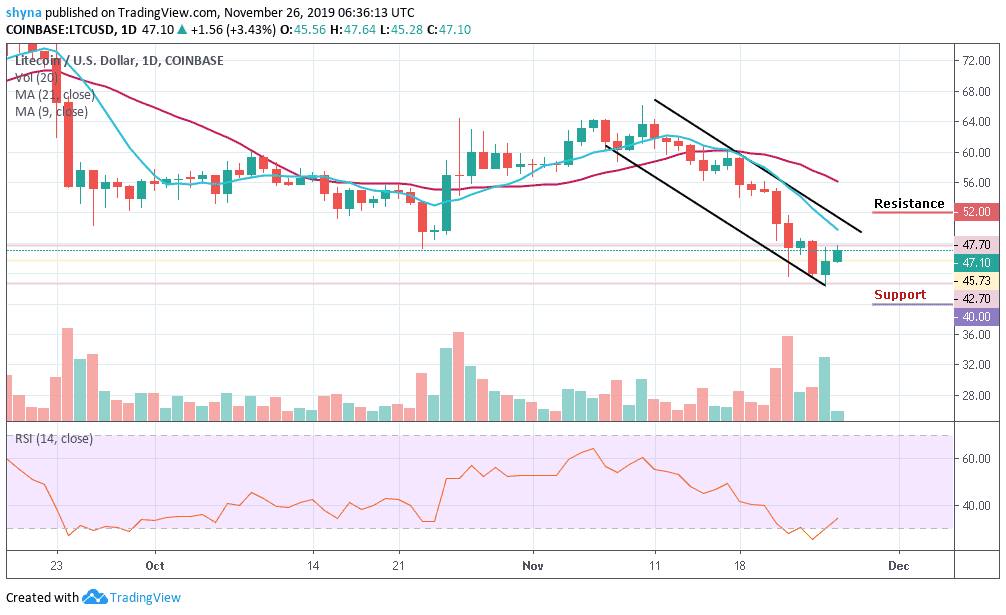
LTC/USD has exhibited strength over the last 24 hours but managed to regain some ground amid technical correction from an oversold territory where it has traveled from $43 to $46. The coin has recovered from the sharp sell-off during early Asian hours. More so, the range of the price swings has been between $42.70 and $47.70. The overall gain of the day stands at 3.43%.
Moreover, though the current price of Litecoin at $47.10 is below both the moving averages of 9 and 21 days within the descending channel, the recovery seems to have started. The cryptocurrency needs to continue its up-trending growth in the coming days to recover properly. As per the current trend, the next resistance level is likely at $48.
Looking at the daily chart, perspective a strong resistance is now created around the 9-day MA at $47.70. It could move towards the upper boundary of the channel and once it is broken, the recovery may be extended towards $52, reinforced by 21-day MA. The next resistance comes at psychological $54 and $56 levels. On the downside, a sustainable move below the intraday level of $42.70 will open up the way to a $40 support level.
However, this barrier is likely to slow down the bears and serve as a jumping-off ground for the recovery. The next support levels to watch for could be $38 and $36 respectively but the RSI (14) is moving out of the oversold zone.
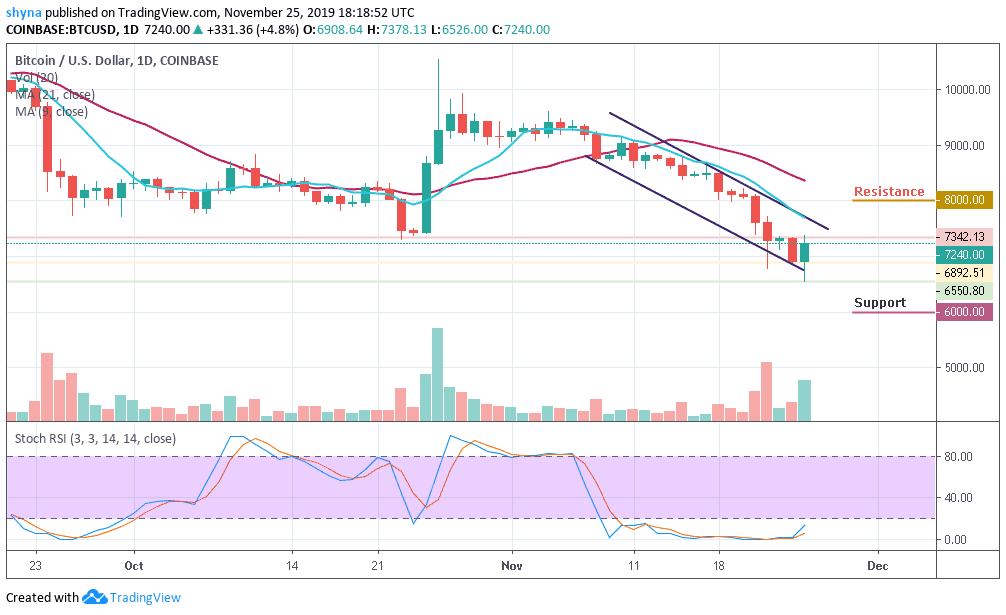
Comparing with Bitcoin, Litecoin price is making an attempt to reach the 9-day moving average for the nearest resistance level of 6625 SAT to be visited. Unless this resistance is effectively breached and the price ends up closing above it, there might not be any reason to expect the long-term bullish reversal.
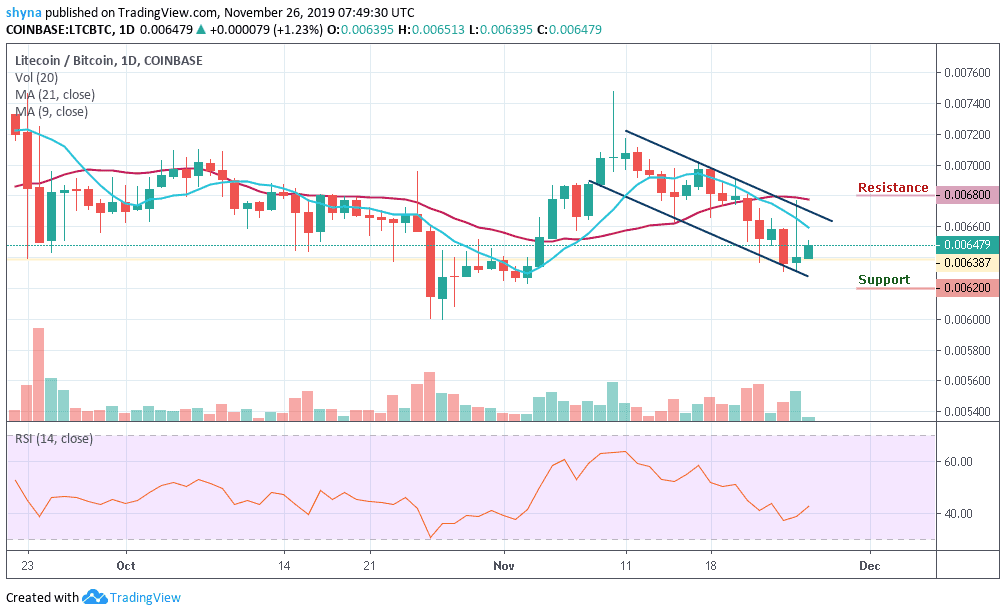
However, trading below the 6387 SAT support, the bear could hijack the trend from the bulls and a possible bearish continuation may likely meet the major support at 6200 SAT before falling to 6100 SAT and below. But as it stands now, if the buyers could put more effort, they may push the market price to the critical potential resistances at 6800 SAT and above while the RSI (14) indicator made a sharp cross above 40-level to confirm the bullish movement.
Please note: Insidebitcoins.com is not a financial advisor. Do your research before investing your funds in any financial asset or presented product or event. We are not responsible for your investing results.
Join Our Telegram channel to stay up to date on breaking news coverage