Join Our Telegram channel to stay up to date on breaking news coverage
Bitcoin (BTC) Price Prediction – November 25
The past week was one of the worst for Bitcoin as the price had seen a $2,000 decline over the past seven days.
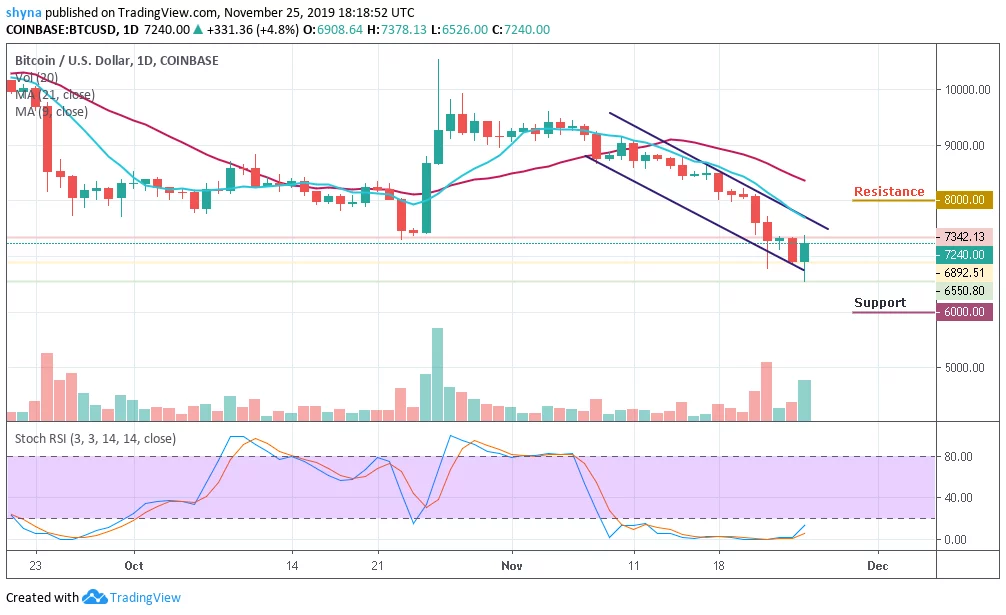
BTC/USD Long-term Trend: Bearish (Daily Chart)
Key levels:
Resistance Levels: $8,000, $8,500, $9,000
Support Levels: $6,000, $5, 500, $5,000

Today, Bitcoin has recorded another new low since May 17, 2019, at $6,513. BTC/USD bulls are not giving up hope as they have endured constant selling pressure from the bears since a few weeks ago. The price dive under $8,000 below the 9-day moving average within the descending channel as the coin sunk beneath several key support levels including $7800, 7,600 and $7,400. However, as the market opens today, the bears pushed Bitcoin below $7,000 and touched the support level of $6,550 which is the monthly low.
Currently, BTC/USD is exchanging hands at $7,240. The positive outcome could be a Hammer candle on the daily chart, which is known as a bullish reversal pattern. Of course, there is still enough time till the daily candle close, but so far, it looks promising. As of writing this, any daily close above $7,500 will be considered bullish for Bitcoin and might signal a temporary end to the past week’s severe declines.
Following the recent gains, Bitcoin is now facing a significant $8,000 resistance level, which was a clear boundary for Bitcoin over the past three days. In case of a break-up, the next resistance lies at $8,500. In order for Bitcoin to return to the bullish track, it will need to at least get over the $9,000 benchmark and confirm it as support by creating a higher-low.
Conversely, the main supports on the downside near $6,500. If there is a downside break below $6,500, the price may accelerate decline towards the $6,000, $5,500 and $5,000 support levels. The stochastic RSI for BTC/USD is currently within the oversold.
BTC/USD Medium-Term Trend: Bearish (4H Chart)
Looking at the 4-Hour Chart, Bitcoin bottomed at $6,540 during early Asian hours. A thick layer of stop orders forced the bears to slow down their assault and allowed for an extended recovery towards $7,300. Once this critical barrier gave in, the upside accelerated and took BTC/USD to $7,261. If the bulls put more effort, the resistance levels of $7,600, $7,800 and $8,000 could be reached.
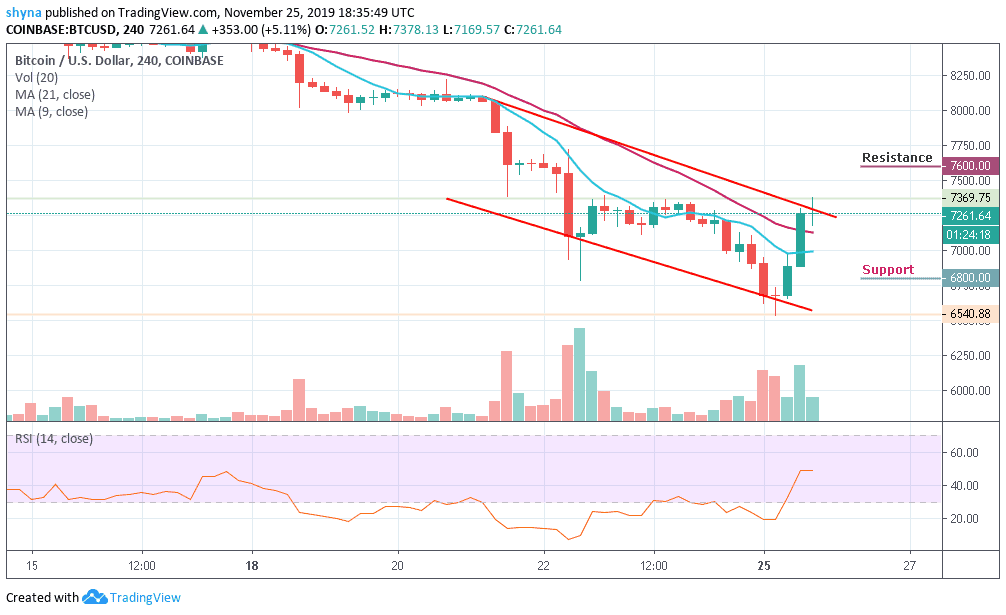
On the downside, the initial support is created below the 9-day and 21-day moving averages located on the approach to psychological $6,800. If it is broken, bears might get a chance to take the lead again. The next support awaits us at $6,400, while the pivotal barrier could be $6,200. The RSI (14) moves below level 50.
Please note: Insidebitcoins.com is not a financial advisor. Do your research before investing your funds in any financial asset or presented product or event. We are not responsible for your investing results.
Join Our Telegram channel to stay up to date on breaking news coverage