Join Our Telegram channel to stay up to date on breaking news coverage
LTC Price Prediction – July 13
The LTC/USD pair is looking for support at $40, where the market is likely to provide a rebound level for the price.
LTC/USD Market
Key Levels:
Resistance levels: $48, $50, $52
Support levels: $41, $39, $37
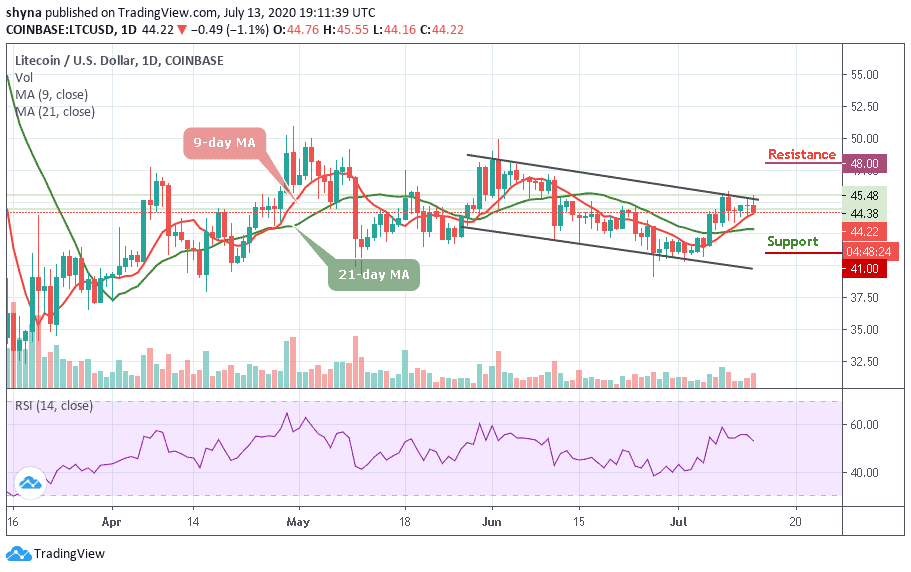
Since a few days ago, LTC/USD has been trading below $46 due to the recent bearish surge. For this reason, the market has currently dropped by 1.1%, which may become more severe if we see immense selling pressure.
Looking at the daily chart, we can see that LTC is still sitting at $44. If the price level can hold well, traders may see a buyback at $45 resistance before breaking up the channel to $47 and above. But as it stands now, the bulls should make an attempt to step back into the market and move the price to the potential resistance levels of $48, $50, and $52.
Meanwhile, considering the latest price drop, the market is likely to fall at $43 and $42 support levels, moving below these mentioned levels, then we can expect the LTC/USD market to continue its bearish pressure while the critical support is expected at $41, $39, and $38 levels. The technical indicator RSI (14) is currently moving below the 55-level, indicating a bearish movement in the market.
Meanwhile, pairing with Bitcoin, Litecoin (LTC) is moving sideways within the channel since two months ago and the price is currently trading at 4712 SAT below the 9-day moving average. With volume accumulating on the price chart, the price may likely fall to 5300 SAT before reaching the 4500 SAT and 4400 SAT support levels.
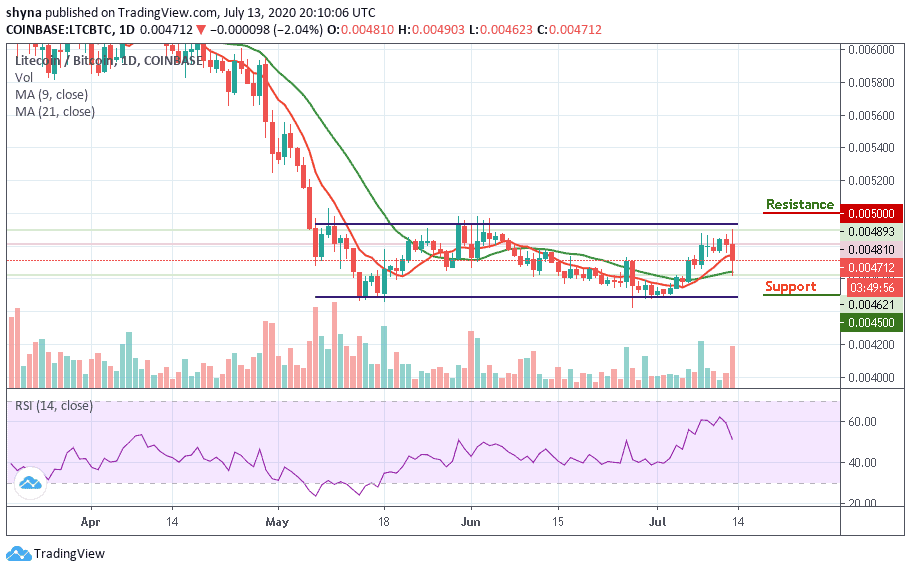
However, the RSI (14) indicator seems to move back below the 50-level, which indicates a downward trend. Moreover, for LTC/BTC to increase and move towards the resistance levels of 5000 SAT and 5100 SAT, the RSI indicator will need to go above the 60-level to show the coming back of the bulls back into the market.
Join Our Telegram channel to stay up to date on breaking news coverage