Join Our Telegram channel to stay up to date on breaking news coverage
Bitcoin (BTC) Price Prediction – July 13
BTC/USD price is slowly approaching crucial supports and the bears need to be very careful once the price reaches the $9,200 support level.
BTC/USD Long-term Trend: Bearish (Daily Chart)
Key levels:
Resistance Levels: $9,800, $10,000, $10,200
Support Levels: $8,800, $8, 600, $8,400
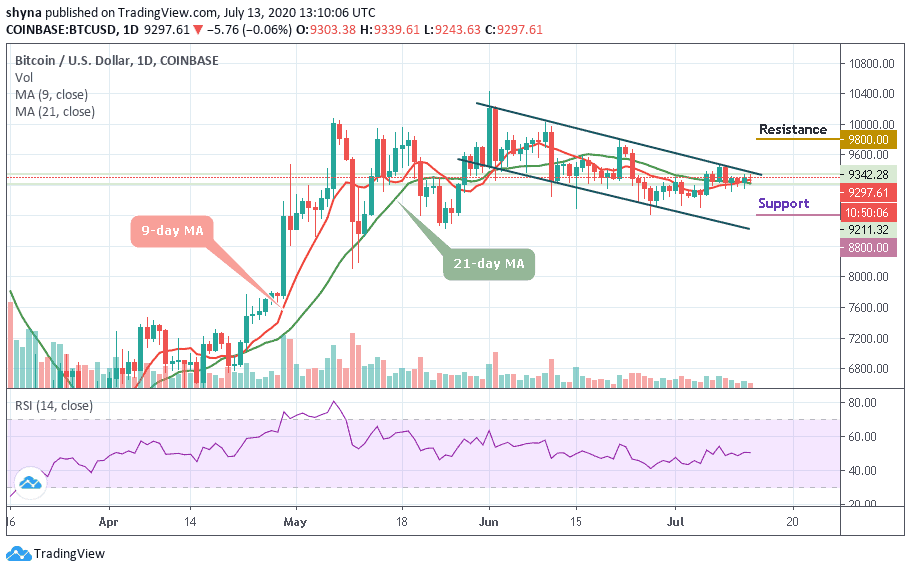
BTC/USD is still struggling to maintain its position above $9,500 but its price saw another dive below the $9,250 mark today. The coin is in a dangerous position as the price slipped below the critical supports. If the breakthrough is confirmed, the downside momentum will gain traction with the next focus on $9,200. At the time of writing, Bitcoin is trading around the moving averages of 9-day and 21-day at $9,297.
However, should BTC price failed to move above the channel; we may see a price cut to $9,000 vital support. A further low drive could send the price to $8,800, $8,600, and $8,400 support levels while the resistance levels lie at $9,800, $10,000, and $10,200. The RSI (14) indicator is suggesting a probable sideways movement in the near future as the signal line moves above 51-level.
BTC/USD Medium – Term Trend: Bullish (4H Chart)
BTC/USD is seen performing well at present. But the traders expect the coin to gain the lost momentum and hit the trade above $9,500. As the volatility hovers, the selling pressure still exists which leads the coin to lose the major support around the moving averages. Meanwhile, the $9,150 and below may come into play if BTC breaks below $9,150 support level.
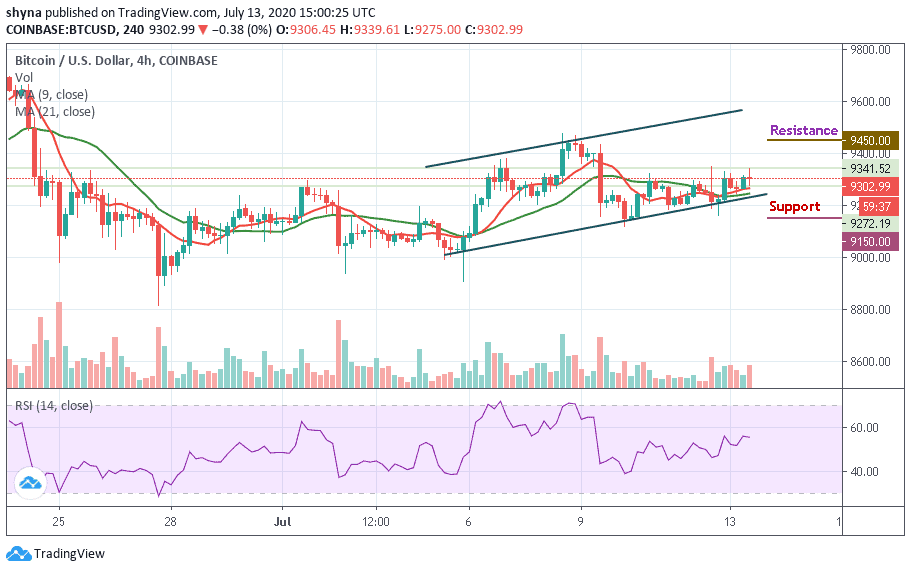
However, if the buyers can strengthen and energize the market, they can further push the price to a $9,400 resistance level. Therefore, breaking the mentioned resistance could also allow the bulls to test the $9,450 and above. More so, the technical indicator RSI (14) is seen moving around 55-level, suggesting sideways movement.
Join Our Telegram channel to stay up to date on breaking news coverage