Join Our Telegram channel to stay up to date on breaking news coverage
LTC Price Prediction – October 25
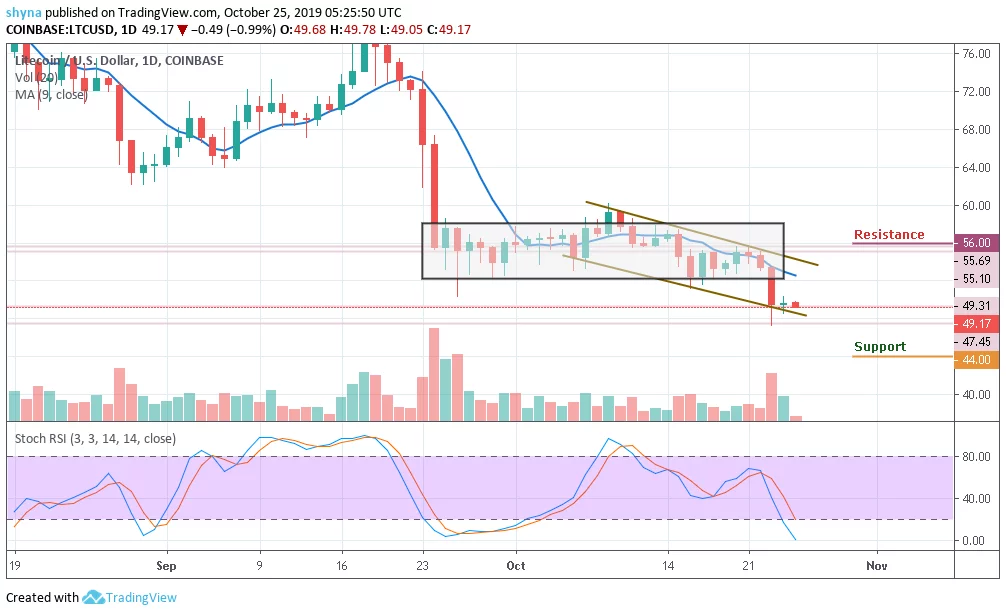
LTC/USD price has moved horizontally after falling from its range. The coin traded in the upward, with gains of 0.95% yesterday.
LTC/USD Market
Key Levels:
Resistance levels: $56, $58, $60
Support levels: $44, $42, $40

At market opening today, the LTC/USD price was observed following a bearish movement below the 21-day moving average. For a month, the crypto has at least kept the price above $50. On the upside, the market movement still remained under $60. Locking operations in the first 3 weeks were dull and offered little trading activities. Despite this, the broken support of the price shows the formation of a higher low trend which gave an indication that the bulls were largely under control.
Meanwhile, LTC/USD could not avoid the bearish wave that ranged the market on October 23. This painful downward trend exerted intense pressure on key support established above $50. More so, the declines devastated the support zone and pushed the coin to less than $48. A low formed just above $47 was replaced by a shallow correction that failed to correct above $50.
Nevertheless, the sixth largest crypto in the world is currently trading at $49.17 after losing 0.99% of its value. The stochastic RSI is heading towards the oversold zone, which shows that an immense bearish pressure may continue to weigh on the support at $48 and that we could witness further declines at support levels of $44, $42 and $40.
Looking at the daily chart, we can see that LTC/USD is still sitting at $49. If the price level can be maintained, we could see a buyback with $53 resistance before breaking the channel at $56, $58 and $60 levels.
Against Bitcoin, the price in Litecoin is moving in sideways within the symmetrical triangle and around the 21-day moving average. The number six crypto on the market cap is yet to define its real direction because the market movement has remained clouded by bearish prices for the past few days.
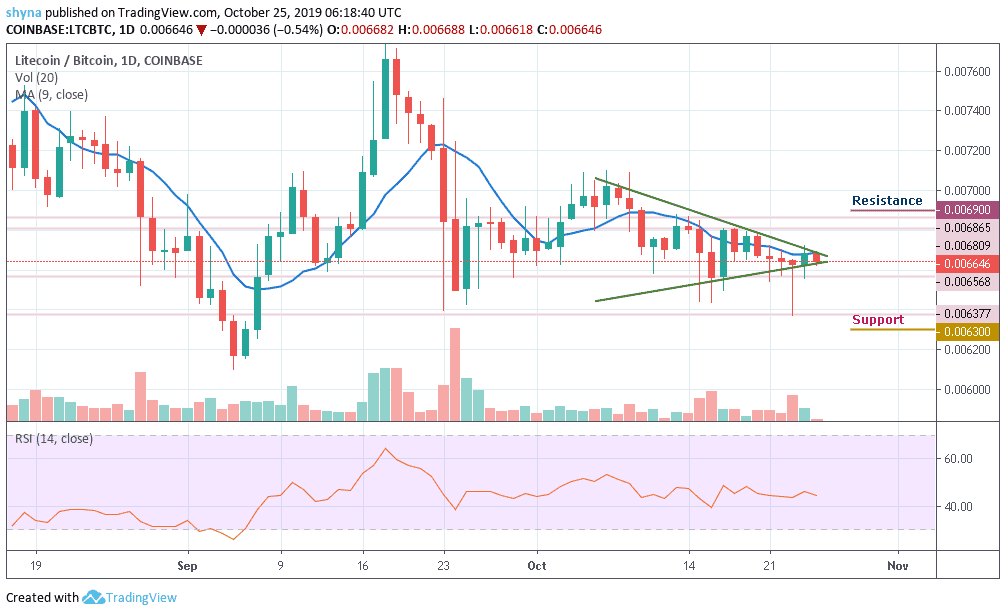
More so, as the RSI (14) moves around 44-level, a bearish step back is likely to roll the market back to the support of 0.0064 BTC with a possible break out of the channel and further declines could be at 0.0063 BTC and below, establishing a new monthly low for the market. The resistance levels to watch are 0.0069 BTC and above.
Please note: Insidebitcoins.com is not a financial advisor. Do your research before investing your funds in any financial asset or presented product or event. We are not responsible for your investing results.
Read more:
- Ripple (XRPUSD) Price Prediction: Potential Bearish Reversal Zone Tested
- Ethereum Price Prediction: ETH/USD Shows Signs of Weakness; Can Price Maintain $380 Support?
Join Our Telegram channel to stay up to date on breaking news coverage