Join Our Telegram channel to stay up to date on breaking news coverage
ETH Price Prediction – August 23
ETH/USD is currently fighting to reclaim the $400 resistance level.
ETH/USD Market
Key Levels:
Resistance levels: $450, $470, $490
Support levels: $335, $315, $295
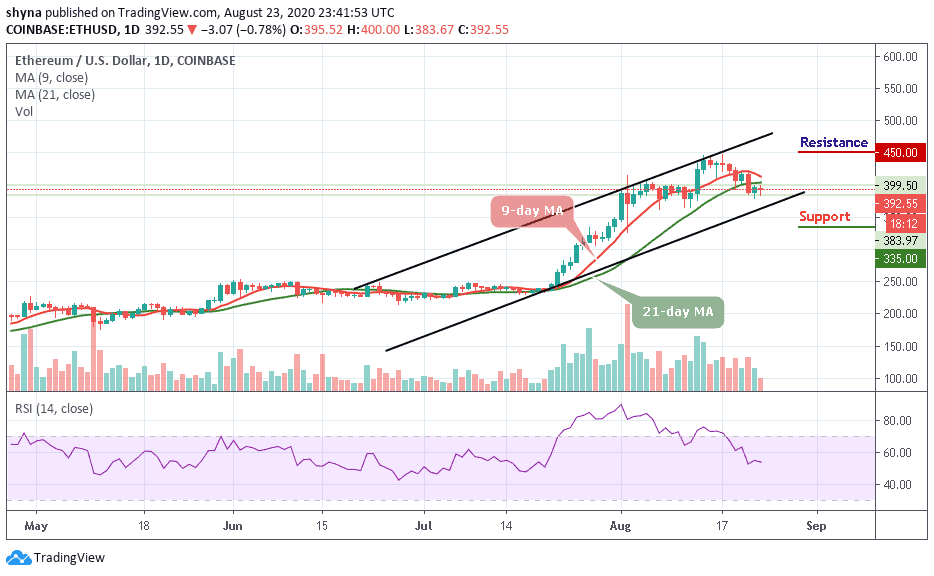
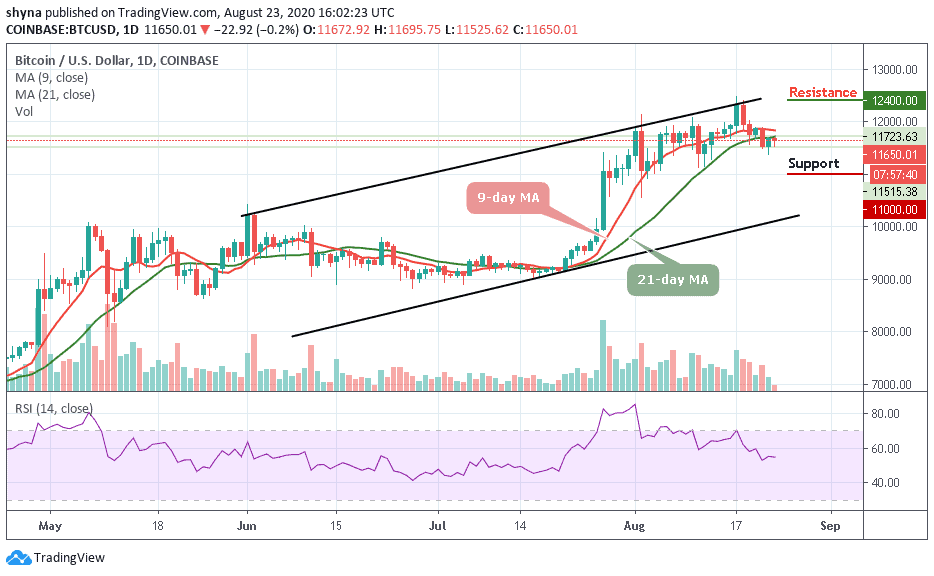
At the moment, ETH/USD is dancing at $391.79 following a 0.97% loss on the day. However, the whole market is mainly in the red, with most cryptos having succumbed to downward pressure. Bitcoin (BTC), for example, is inching closer to $11,350 support after failing to hold above $11,600. In addition, there is a possibility of retracement towards $420 will occur before the second-largest crypto gathers the strength to zoom toward the resistance of $450, $470, and $490.
Would Ethereum Go up or Down?
If the sellers push ETH beneath $380, the next support lies at $360. This is followed by significant support below the lower boundary of the channel at $350, and a downside may come into focus. If $350 breaks, further support lies at $335, $315, and $295 levels.
As mentioned, the RSI (14) is moving beneath the 55-level, and if it continues to fall, the increased bearish pressure could drive ETH/USD toward the lower boundary of the channel. However, the signal line may drop more and looks primed for another bearish crossover signal.
Against Bitcoin, we can see that Ethereum is following the downward trend. As the price falls, sellers are posing an additional threat for buyers to reach the support level of 0.032 BTC where the nearest target is located. However, an eventual break below the lower boundary of the channel may cause Ethereum to collapse.
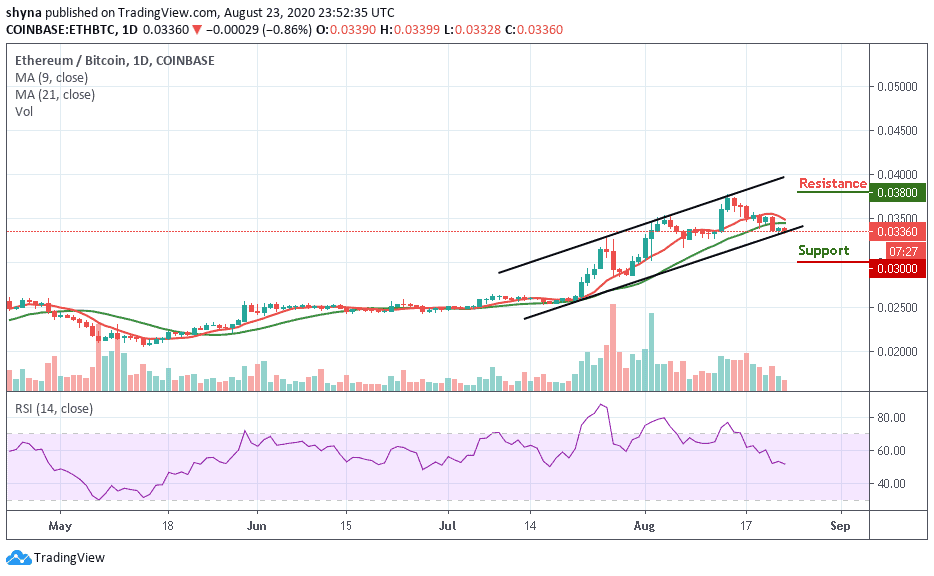
Furthermore, the continuation of the downtrend could hit the main support at 0.031 BTC before falling to 0.030 BTC and below. More so, the buyers may likely push the market above the 9-day and 21-day moving averages to reach the potential resistance at 0.038 BTC and above if a rebound plays out. The RSI (14) is still focusing on the downside, indicating that the sellers are in control.
Join Our Telegram channel to stay up to date on breaking news coverage