Join Our Telegram channel to stay up to date on breaking news coverage
Bitcoin (BTC) Price Prediction – August 23
Bitcoin (BTC) is back around $11,600 after recovering from yesterday’s price dives.
BTC/USD Long-term Trend: Bullish (Daily Chart)
Key levels:
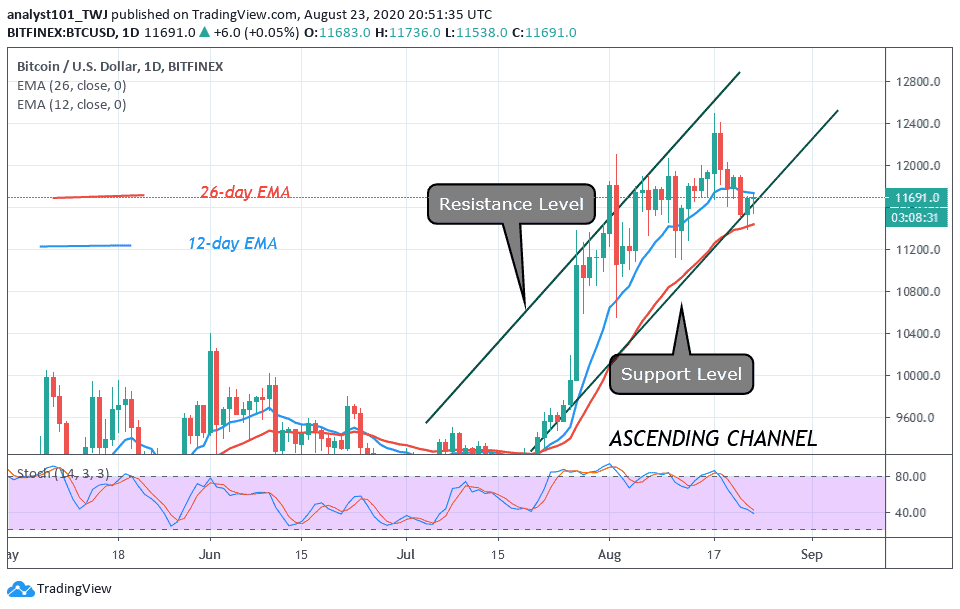
Resistance Levels: $12,400, $12,600, $12,800
Support Levels: $11,000, $10,800, $10,600
BTC/USD started the day with a downside movement as the coin touched the daily low at $11,515 while many coins started moving the same direction as well, but later, the Bitcoin market started improving, making an attempt to cross above the 21-day moving average. Since the beginning of this month, BTC/USD has been moving between the $9,300 – $12.300 and now changing hands at $11,650.
What is Next for Bitcoin (BTC)
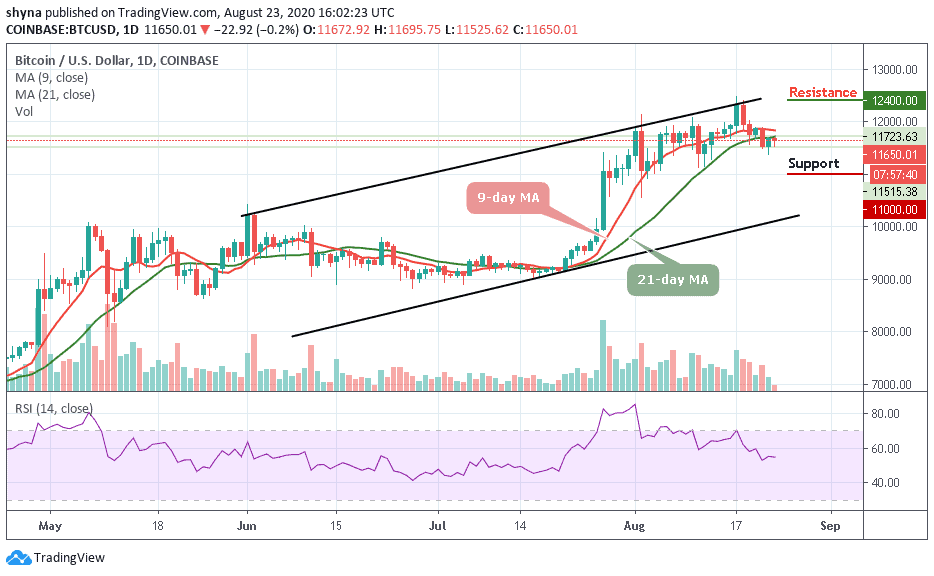
From a technical standpoint, BTC/USD now struggles with significant support turned resistance area at $11,650. Should in case Bitcoin decisively overcomes it, the next resistance level is likely $11,800 before another stand-off with the psychological line of $12,000 and $12,100. Meanwhile, BTC/USD saw a false breakout last week, spiking to $12,500, but quickly losing it.
Moreover, if the market decides to follow the downtrend, Bitcoin’s price may drop to $11,300, and should this support fails to contain the sell-off, we may see a further drop to $11,000, $10,800, and critically $10,600. But if the market price crosses above the moving averages, BTC/USD may likely reach the potential resistance levels at $12,400, $12,600, and $12,800 respectively. Meanwhile, the RSI (14) signal line is moving around the 55-level, suggesting a sideways movement.
BTC/USD Medium-Term Trend: Bearish (4H Chart)
Looking at the 4-hour chart, the bears have been dominating the market for the past few days now, but the bulls are trying to step back into the market to defend the $11,300 support. If not, the $11,200 and below may come into play.
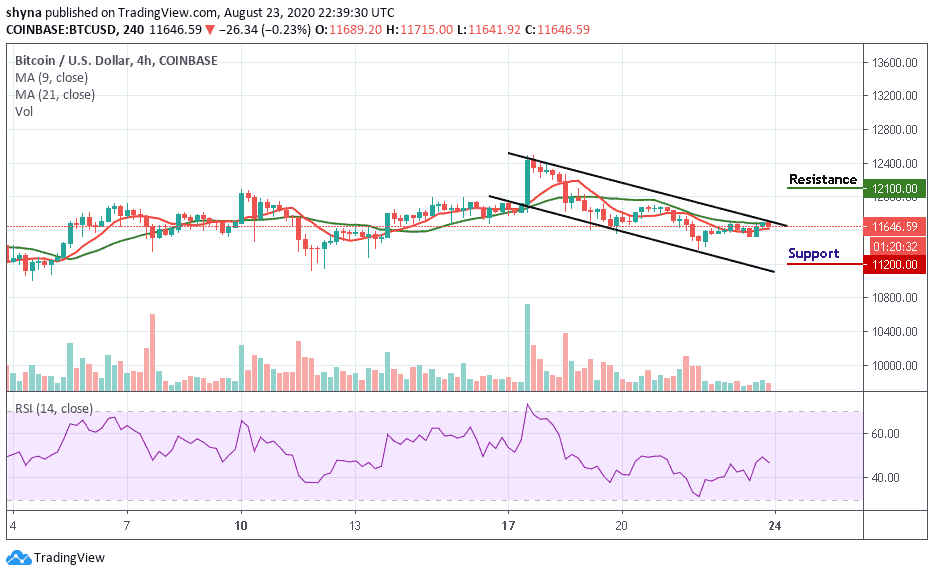
However, if the bulls can reinforce and power the market, traders may expect a retest at $12,000 resistance level, and breaking this level may further push the price towards the resistance level of $12,100 and above. The RSI (14) is seen moving below 50-level, indicating bearish movement.
Join Our Telegram channel to stay up to date on breaking news coverage