Join Our Telegram channel to stay up to date on breaking news coverage
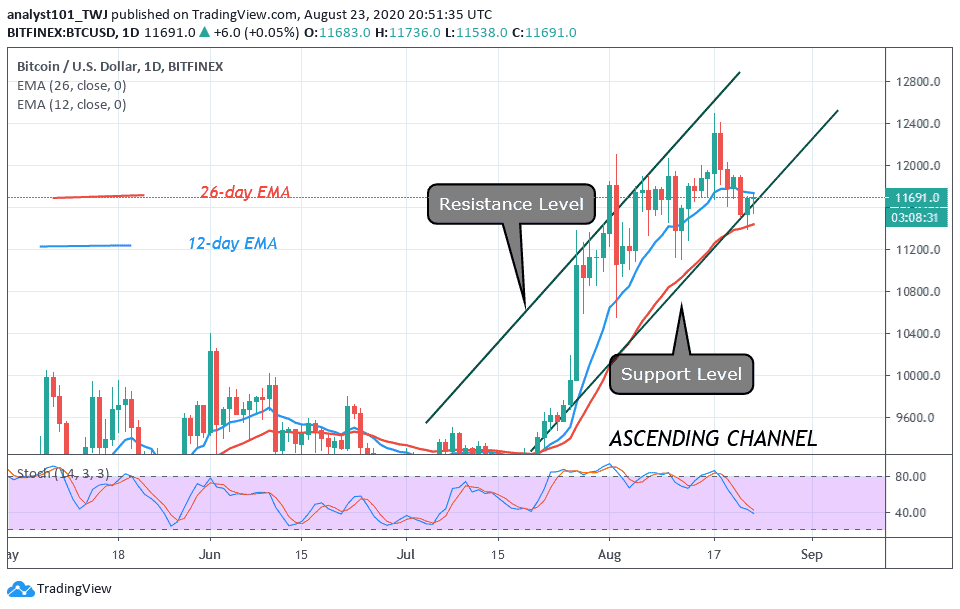
BTC/USD fell to $11,400 support on August 21 and resumed consolidation above the current support. For the past three days, BTC has been fluctuating between $11,400 and $11700. There has been no significant price movement as the crypto trades marginally.
Resistance Levels: $10,000, $11, 000, $12,000
Support Levels: $7,000, $6,000, $5,000

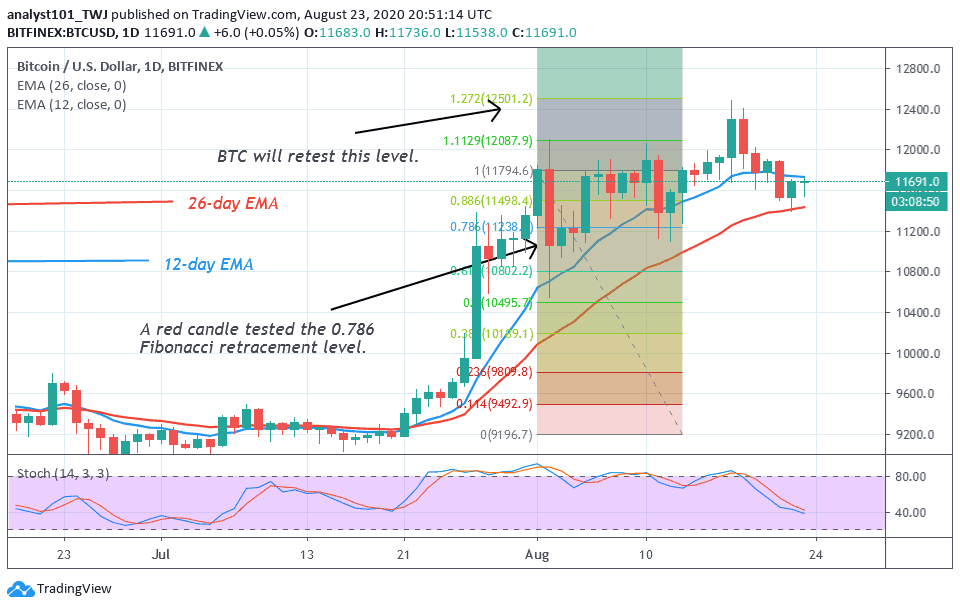
Bitcoin’s upward move is facing resistance at the $11,800 resistance zone. Buyers have made two attempts to move upward but have been repelled twice. Since August 1, the $11,800 resistance is usually broken during a price rebound. Nonetheless, the current resistance can be breached if the price rebounds above the $11,600 support. On the upside, a rebound will propel price to break the $11,800 resistance.
A subsequent rebound will break the $12,000 overhead resistance. Nonetheless, the major resistance for upside trading is at the $12,000 high. If this price level is broken for the second time, Bitcoin will make a strong bullish move and at the same time price movement will be accelerated. Meanwhile, BTC is still trading marginally on the upside.
There Is Anxiety and Fear Among Analysts That a Strong Dollar Will Weaken Bitcoin’s Bullish Momentum
This strong fear came on the backdrop of the U.S dollar Index rallying, leading the analysts to speculate whether a strong dollar will slow down Bitcoin bullish momentum. According to reports, about 48 hours ago the U.S Dollar Index climbed up, this led the price of gold to fall by 3.5%. In recent times, Gold has been rallying despite the uncertainty in the world economy.
A trader called Scott Melker indicated that what is more compelling is the inverse relationship with Bitcoin and Dollar than its correlation with the Stock market. An apparently inverse correlation between the dollar and Bitcoin might indicate that the weakening dollar partially propel BTC’s recent rally.

Meanwhile, Bitcoin has resumed uptrend to retest the previous highs. If the bulls are successful above the $12,000 resistance, it will be a huge success and eventual uptrend resumption.
Join Our Telegram channel to stay up to date on breaking news coverage

