Join Our Telegram channel to stay up to date on breaking news coverage
BCH Price Prediction – August 23
The Bitcoin Cash has remained range-bound with the short-term outlook ranging well within the channel.
BCH/USD Market
Key Levels:
Resistance levels: $315, $325, $335
Support levels: $250, $240, $230
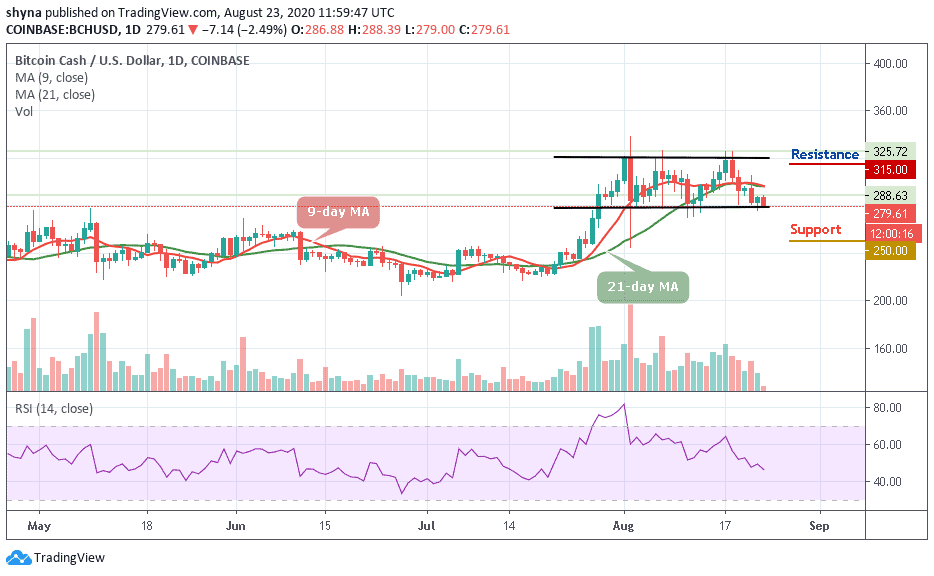
For the past few days, BCH/USD has been moving in sideways to support the market against the selling pressure. However, the coin is currently trading below the 9-day and 21-day moving averages at $279. Meanwhile, should BCH fall back to the old support and break-even, the bears might come back to dominate the market but at the time of writing, the market is following a sideways movement.
What to Expect from Bitcoin Cash (BCH)
If the market drives below the lower boundary of the channel, the BCH price may slump to the initial support at $260, which may later take the price back to its critical supports at $250, $240, and $230. Presently, the RSI (14) stays below average at 47-level which could increase the selling pressure, and in case there is a rebound, BCH/USD might break above the 9-day and 21-day moving averages to reach the $300 resistance level. Meanwhile, a bullish continuation could hit the resistance levels at $315, $325, and $335.
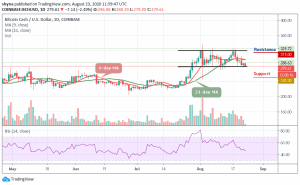
Comparing with Bitcoin, the recent sideways movement is due to price stability. At the moment, the market is preparing to change the trend and a short-term bearish breakout is most likely to play out because the technical indicator RSI (14) may cross below 40-level and this could find the nearest support levels at 0.023 BTC and below.

However, the only condition for the resumption of the bullish trend is if the 0.025 BTC level continues to provide support for the market, then the price may be pushed to the resistance level of 0.026 BTC and above. Meanwhile, the BCH/BTC pair continues to remain in sideways movement hovering below the 9-day and 21-day moving averages.
Join Our Telegram channel to stay up to date on breaking news coverage