Join Our Telegram channel to stay up to date on breaking news coverage
LTC Price Prediction – August 23
Litecoin market has been witnessing some drops since a few days ago, what could be the next direction?.
LTC/USD Market
Key Levels:
Resistance levels: $70, $72, $74
Support levels: $50, $48, $46
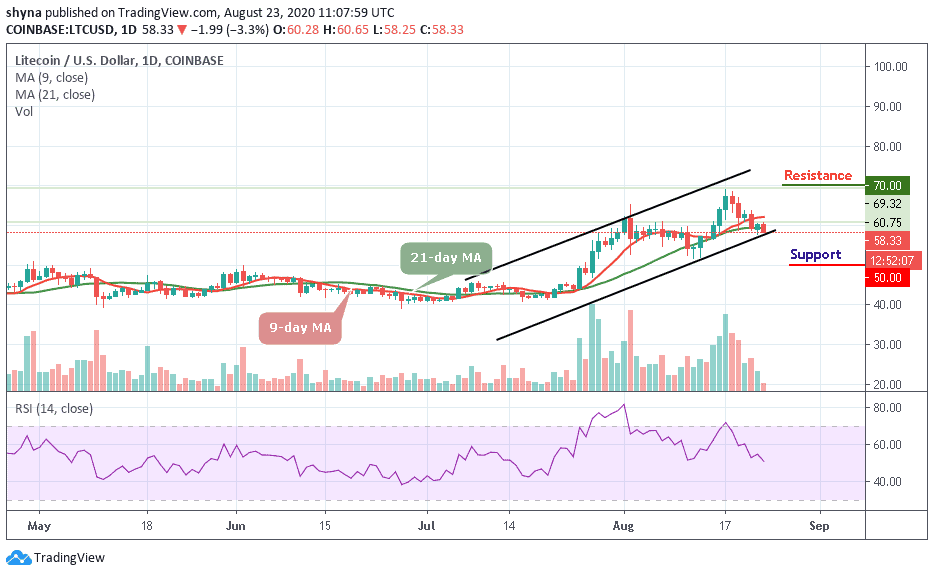
LTC/USD is having a hard time deciding which direction to take. A few days ago, the cryptocurrency couldn’t break $60 and has been rejected after touching the $60.75 daily high. More importantly, the bulls need to climb above $60 convincingly as a clear break above this level could take the coin up to $65 level.
What is the Next Direction for LTC/USD?
As it is now, the RSI (14) is facing the south as the signal line nosedives below 55-level. Therefore, a possible retracement below the 21-day moving average may drag the price below the lower boundary of the channel to reach the critical supports at $50, $48, and $46, creating a new monthly low. But if the market price decides to move upward, buying pressure may further to potential resistance at the $60 and $64.
However, as it appeared now on the daily chart, there’s a need for a pullback for the market to regain strength. A sustainable move above the 9-day moving average is needed for the upside to gain traction with the next focus on $70, $72, and $74 resistance levels.
By comparing with Bitcoin, the Litecoin price is still following a bearish sentiment as the coin suffers a continuous downtrend pressure from Bitcoin. However, if the bulls attempt to gain momentum, the bears are likely to keep releasing a huge pressure on the market as the technical indicator RSI (14) heads to the south.
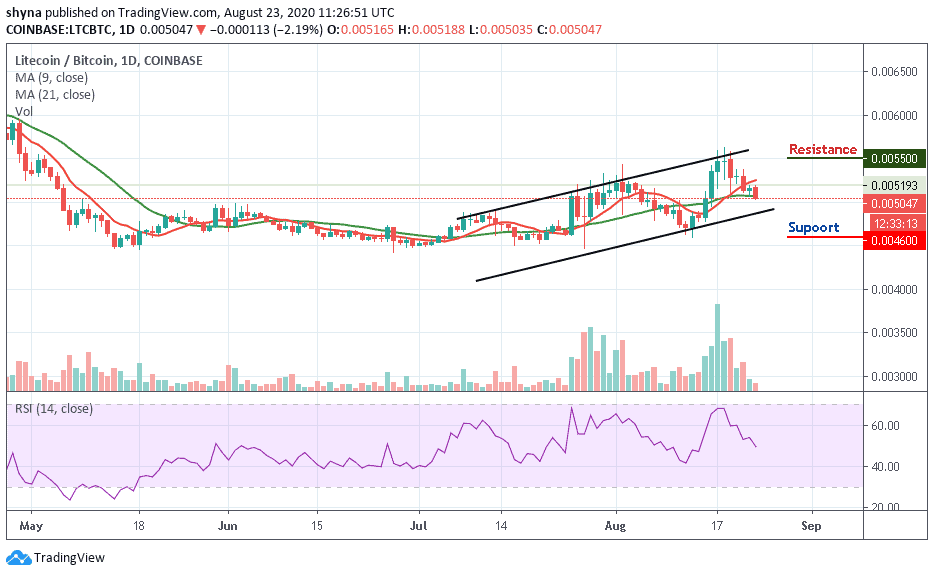
Moreover, if the Litecoin falls below the 21-day moving average, it could significantly cross the lower boundary of the channel which may push the price to the critical supports at 4600 SAT and below. In case of a rebound, the coin could retest the 5300 SAT before resuming the rally. If the bulls manage to stay well above this level, traders could see a bull-run to the resistance level of 5500 and above.
Join Our Telegram channel to stay up to date on breaking news coverage