Join Our Telegram channel to stay up to date on breaking news coverage
Sellers may take over Ripple market
Further increase in the bears’ momentum may result to the breakdown of the support level of $0.50, which may leads to further price reduction to $0.47 and $0.45 levels. In case the Bulls break up the resistance level of $0.52, it may increase Ripple to $0.56 and $0.58 levels.
XRPUSD Price Analysis – October 10
Key Levels:
Supply levels: $0.52, $0.56, $0.58
Demand levels: $0.50, $0.47, $0.45
XRP/USD Price Medium-term Trend: Bullish
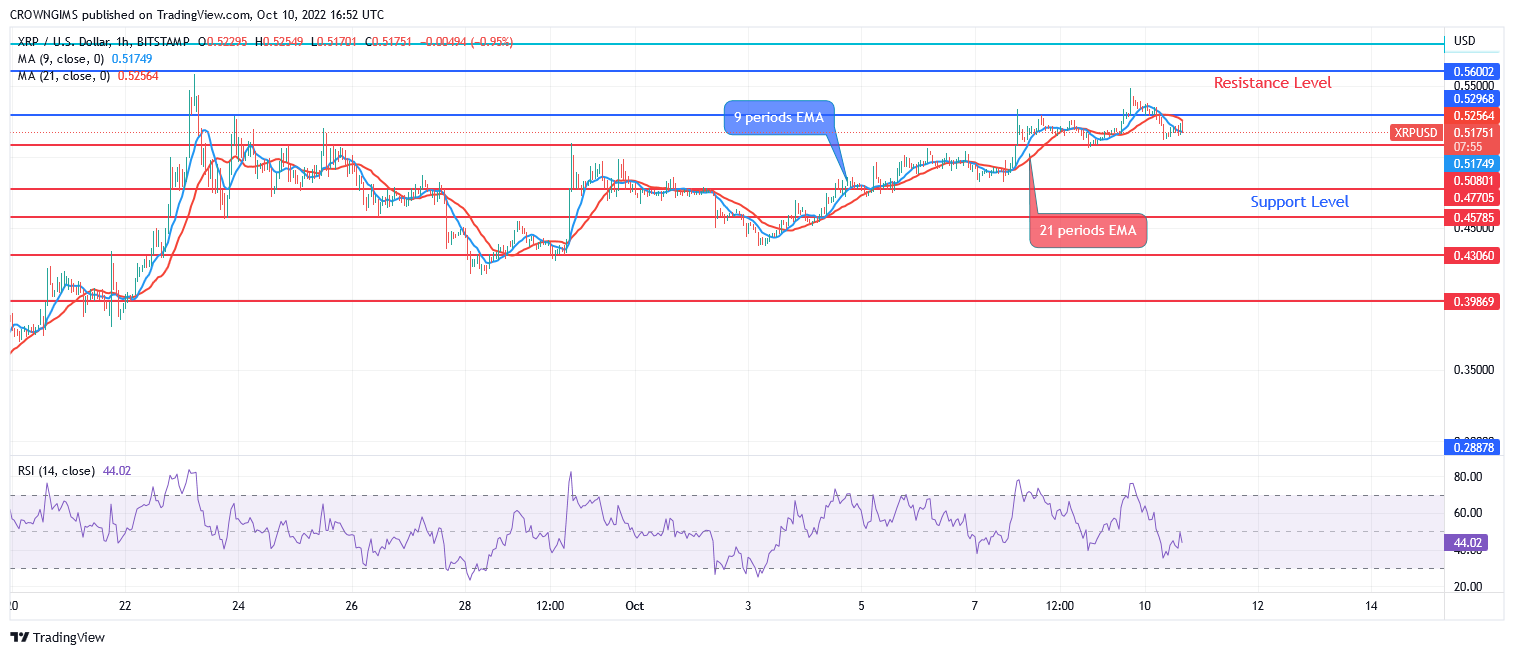
XRP/USD is bullish on the medium-term outlook. The crypto is on the strong bullish movement. The bullish trend commenced when the price action formed a “W” chart pattern at $0.28 support level. It is a bullish pattern and that is why the price soars towards north. The trend made former resistance levels turned to support levels. The resistance level of $0.56 is already tested. The price pulled back to retest the support level of $0.47. Buyers returned to the market with force. At the moment, Ripple is targeting previous high at $0.56.
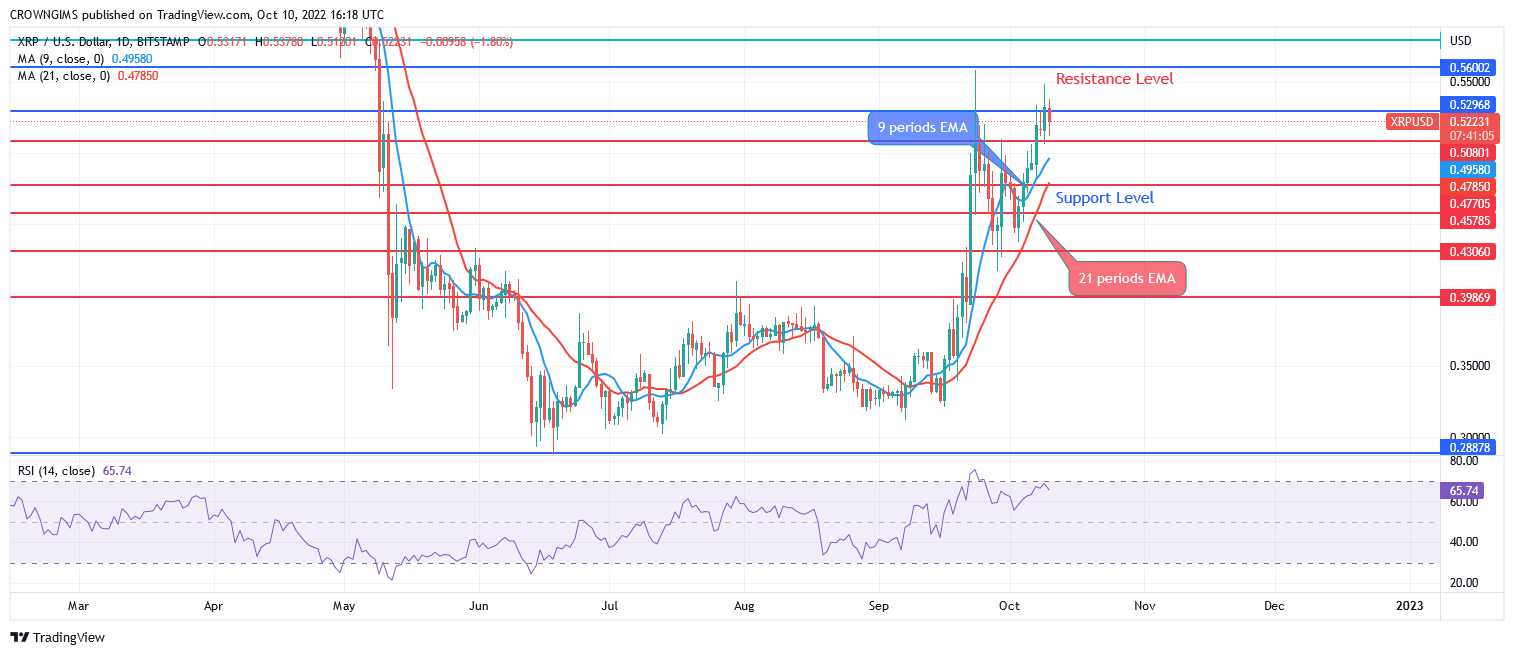
XRP is trading above the 9 periods EMA and 21 periods EMA. Buyers are dominating the market. The Relative Strength Index period 14 is at 64 levels with the signal lines bending down which connotes sell signal. Further increase in the bears’ momentum may result to the breakdown of the support level of $0.50, which may leads to further price reduction to $0.47 and $0.45 levels. In case the Bulls break up the resistance level of $0.52, it may increase the price to $0.56 and $0.58 levels.
Your capital is at risk
XRP/USD Price short-term Trend: Bullish
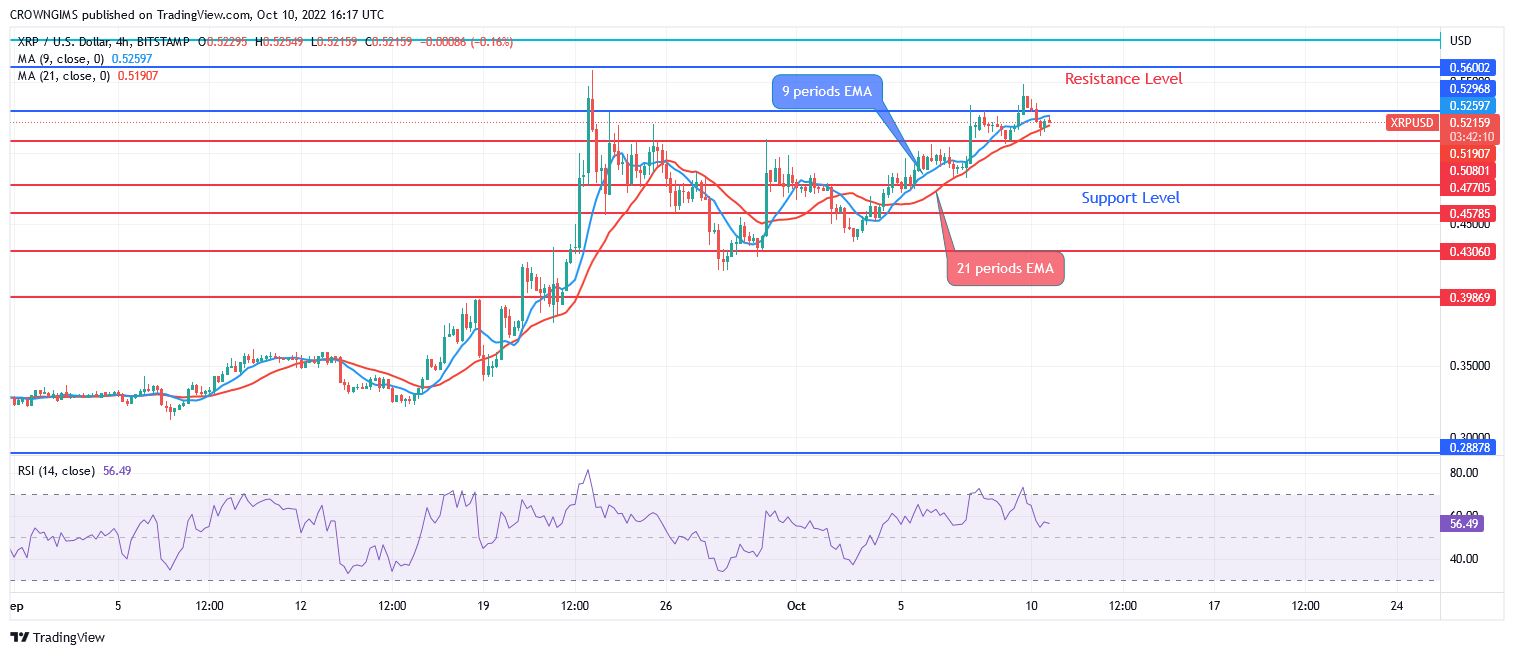
On the 4-hour time frame outlook, XRPUSD is bullish. Bullish movement continues in the Ripple market. When the coin pulled back, it tested the support level of $0.43. Buyers interrupted the pullback and the price bounce up at $0.45 level. The price is increasing gradually to retest the previous high.
XRP price is trading above the 21 periods EMA and 9 periods EMA which indicates a bullish movement in Ripple market. The relative Strength index period 14 is at 54 levels with the signal lines pointing down to indicate a sell signal.
Join Our Telegram channel to stay up to date on breaking news coverage
