Join Our Telegram channel to stay up to date on breaking news coverage
Litecoin Price Prediction – March 4
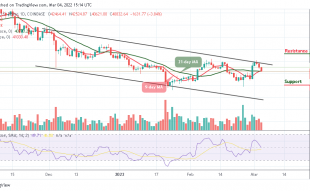
The Litecoin price prediction shows that LTC is likely to make a comeback within the channel as its sell-offs may be extended further.
LTC/USD Market
Key Levels:
Resistance levels: $145, $155, $165
Support levels: $75, $65, $55
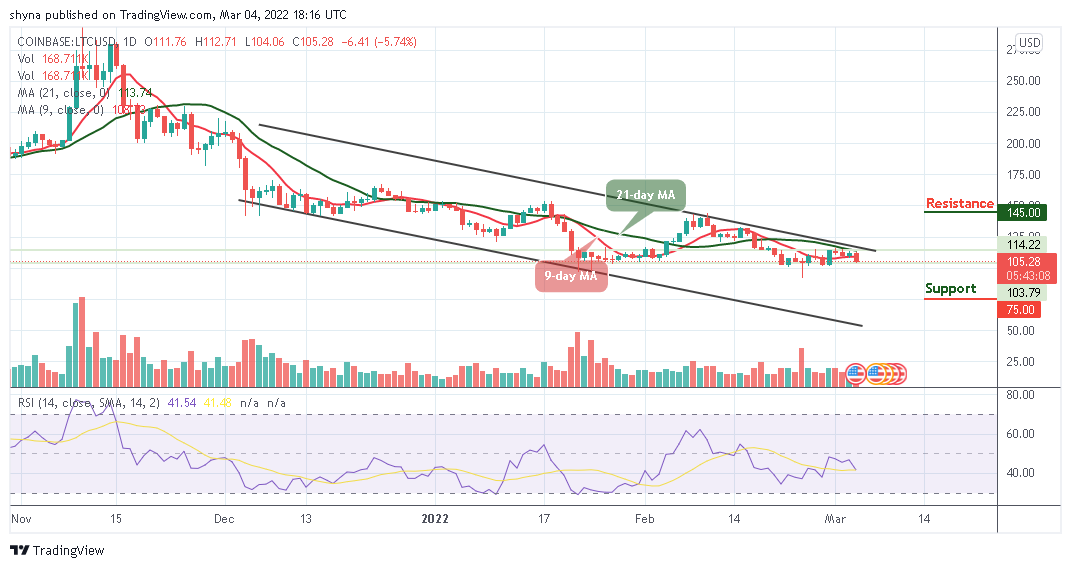
LTC/USD is currently changing hands at $104.09, down from the recent high of $112.71 that was attained during the European session today. The Litecoin price is moving synchronously below the 9-day and 21-day moving averages on the market, and it is mainly influenced by speculative sentiment and technical factors, while the coin may continue to follow a downward movement in the coming session.
Litecoin Price Prediction: Litecoin (LTC) Ready for the Downside
The Litecoin price is hovering below the 9-day and 21-day moving averages as bulls failed to hold the ground. The widespread retracement on the market could push the coin to the south with the next local support located at $100 as this level is likely to limit the correction to serve as a jumping-off ground for another bullish movement.
However, if the coin continues to drop, it is likely for the sell-off to gain traction with the next focus on $75, $65, and $55 support levels. On the upside, the initial resistance may be created above the upper boundary of the channel at the $130 level and traders may need to see a sustainable move to the upside. The further bullish movement could touch the resistance levels of $145, $155, and $165. On the contrary, the technical indicator Relative Strength Index (14) is moving to cross below 50-level, suggesting more bearish signals.
When compares with Bitcoin, the Litecoin price continues to experience a serious downtrend, as the coin moves below the 9-day and 21-day moving averages. The bulls could not push the market to the upside as the technical indicator Relative Strength Index (14) remains below 40-level.
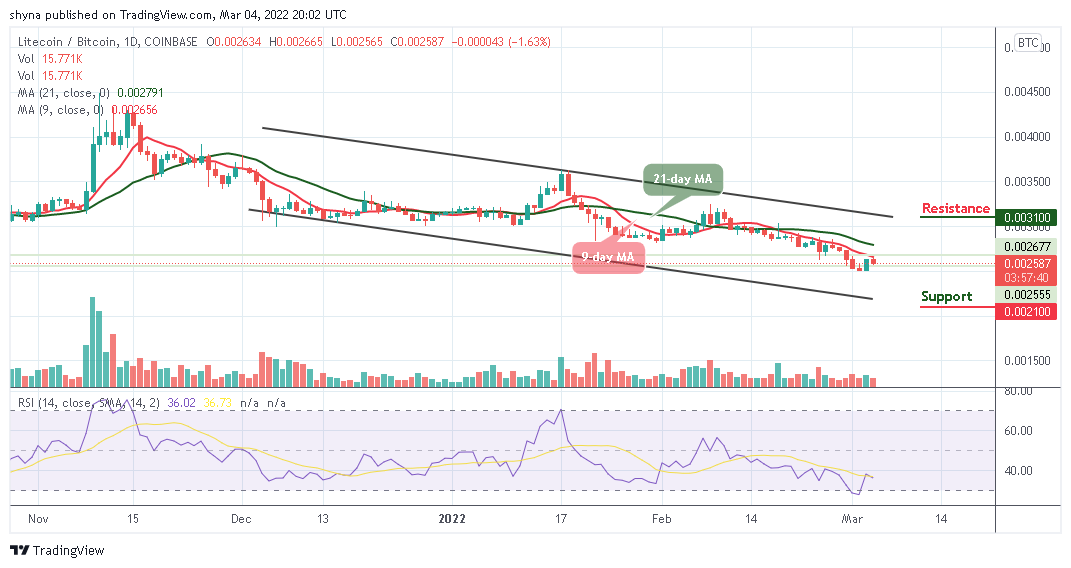
However, the critical support level could be located at 2100 SAT and below. Moreover, if bulls begin to power the market, the coin may likely break above the 9-day and 21-day moving averages to find the potential resistance level at 3100 SAT and above.
Looking to buy or trade Bitcoin (BTC) now? Invest at eToro!
68% of retail investor accounts lose money when trading CFDs with this provider
Join Our Telegram channel to stay up to date on breaking news coverage