Join Our Telegram channel to stay up to date on breaking news coverage
Litecoin Price Prediction – February 28
The Litecoin price happens to be one of the best-performing coins as it breaks to the upside to touch the daily high of $111.
LTC/USD Market
Key Levels:
Resistance levels: $150, $160, $170
Support levels: $65, $55, $45
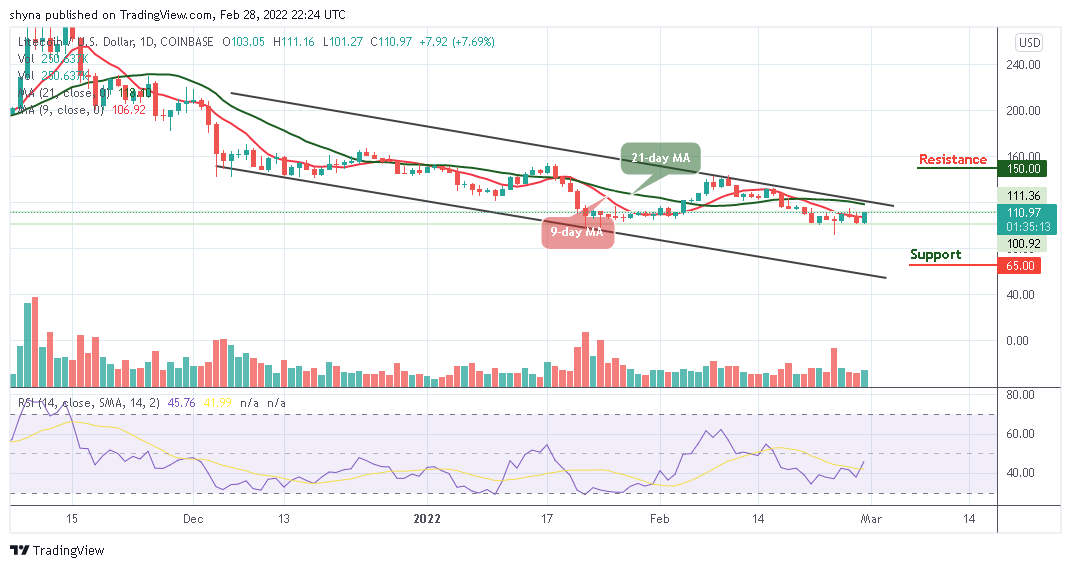
At the time of writing, LTC/USD is crossing above the 9-day moving average as the coin hit gains of over 10% in the last 24 hours. The coin is trading above the 9-day moving average and could also cross above the 21-day moving average if the bulls put more effort while the technical indicator Relative Strength Index moves above 45-level.
Litecoin Price Prediction: Litecoin (LTC) Could Target $120 Level
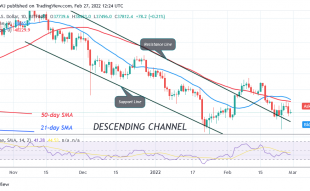
Looking at the daily chart, the Litecoin price keeps moving with high pressure towards the upper boundary of the channel. The coin is now roaming around the $110.97 level, but if the market continues the surge and squeeze; the $120 resistance level may surface in the next few positive moves. Similarly, Litecoin (LTC) might further look for higher levels if the bulls show commitment.
Moreover, the market is currently displaying a sign of subduing volatility with prices ready to stay above the channel. Meanwhile, with the look of things, traders can see that the trading volume is rising heavily. Therefore, if LTC/USD decides to stay under the control of the bulls, the price may spike to the potential resistance levels at $150, $160, and $170. But on the downside, any movement towards the lower boundary of the channel may bring the price to the support levels of $65, $55, and $45 respectively.
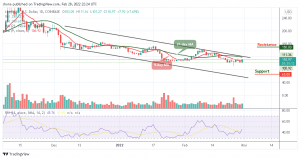
Against Bitcoin, Litecoin (LTC) keeps sliding below the 9-day and 21-day moving averages to reach the nearest support at 2500 SAT. This support may be effectively exceeded and the price could eventually need to close below it, therefore, there might not be any reason to expect the long-term bullish reversal.
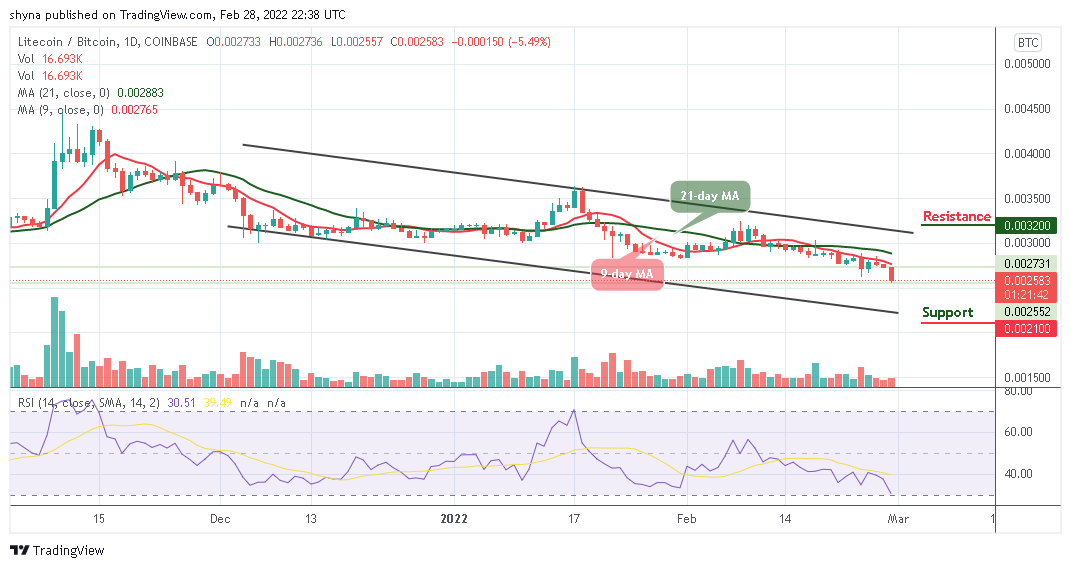
However, if the coin continues to face the south, it could refresh lows under 2200 SAT and a possible bearish movement may meet the major support at 2100 SAT and below while the buyers could push the market to the potential resistance at 3200 SAT and above but the technical indicator Relative Strength Index (14) is heading to the negative side.
Looking to buy or trade Litecoin (LTC) now? Invest at eToro!
68% of retail investor accounts lose money when trading CFDs with this provider
Join Our Telegram channel to stay up to date on breaking news coverage