Join Our Telegram channel to stay up to date on breaking news coverage
LTC Price Prediction – March 12
Recently, LTC/USD witnessed a sharp decline having slightly reached past a market peak of the $120 mark on February 20. The crypto has now been on a light recovery-move from a low of $160 to trade around $210 as at the time of writing.
LTC/USD Market
Key Levels:
Resistance levels: $240, $260, $280
Support levels: $160, $140, $120
LTCUSD – Daily Chart
From the technical point of viewing, the ETH/USD has been safely finding support around the 14-day SMA trend-line mostly while a visible drop occurs in the crypto-economy. That for a reason has made the ETH/USD market keep its bullish trend outlook intact. The 14-day SMA indicator is located above the 50-day SMA with a small space separating them apart. And, they are placed below the present market trading spot. The Stochastic Oscillators are now into the overbought region and, they appear to begin a consolidation move within it. 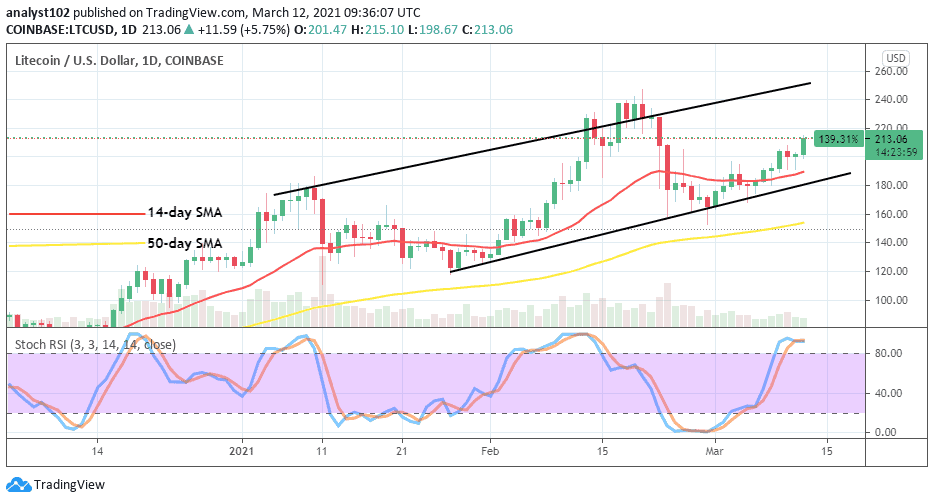
What could be the LTC/USD market’s next price action?
It is much more expected of LTC/USD market to push northward further beyond the $240 resistance level while bulls hold strong during a consolidation move that is bound to happen in the crypto-trade in no time. If that assumption is achieved, the price may encounter a pit stop around the $280 resistance line which may afterward give birth to seeing some higher lows for a while.
Talking about a downward move, bears will have to be on the lookout for a daily bearish candlestick engulfing about four or five past trading candlesticks formed before a decent sell position can be considered. Meanwhile, that has to be the trading period when an upward move has exhausted its energy. A re-occurrence of the correctional move may occur at the key resistance level of $240 while price lessens action for a long time at a touch of it.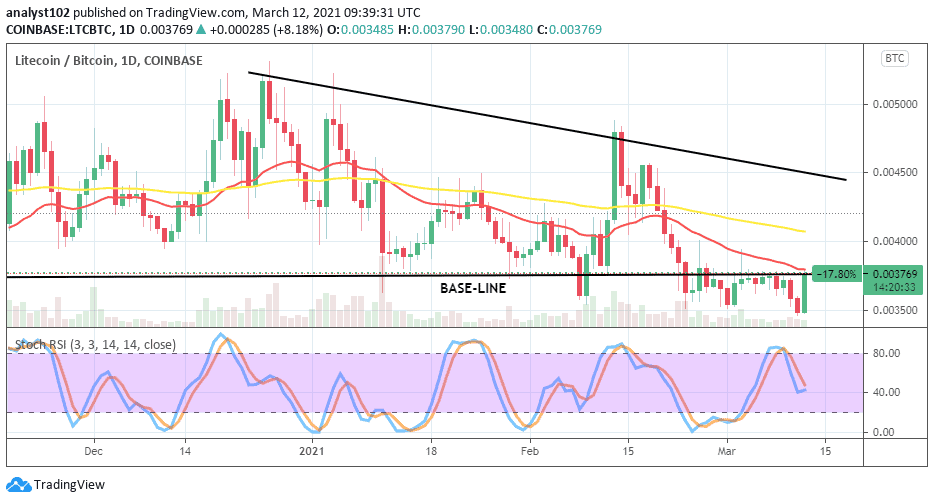
LTC/BTC Price Analysis
There now looks as if the base-crypto is on the set of getting out of the pressures exerted on it by the counter-crypto for a couple of trading days’ sessions. Litecoin is seen pushing harder from an intense dump slightly below its usual base-line. A bullish candlestick is on forming closer from below the 14-day SMA trend-line. The 50-day SMA indicator is located over the smaller SMA. The Stochastic Oscillators now attempt closing the hairs at range 40 to signal a return of an upward move. That suggests that very soon the base-crypto will regain the market momentum.
Join Our Telegram channel to stay up to date on breaking news coverage