Join Our Telegram channel to stay up to date on breaking news coverage
LTC Price Prediction – July 18
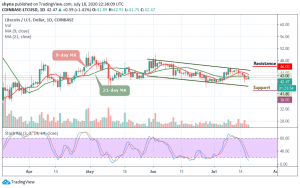
In the opening hours of the day, Litecoin price touches $43 after several days of downtrends.
LTC/USD Market
Key Levels:
Resistance levels: $46, $48, $50
Support levels: $38, $36, $34

LTC/USD bulls have overcome the bears above the $40 support as the Litecoin bulls have survived the downward threat after breaking above the $41. But if the price can cross above the 9-day and 21-day moving averages, the upward movement will be confirmed by the bulls. Meanwhile, buyers have a second hurdle to jump over if the upside range trading should commence.
As the market continues its upward move, the bulls have to break the $44 resistance to begin its upside range trading. However, LTC/USD could rise and begin its fluctuation between $43 and $44, if buyers are successful over the $45 resistance. A break above this resistance level may accelerate the price to retest the $46 resistance since June 11. A possible rally to $50 is likely if the bulls overcome the $48 overhead resistance.
In other words, if the bulls face rejection at the $43 resistance, there could be a bearish reaction. A downward movement of the coin is possible if the $40 and $39 support fails to hold. After the $40 region is broken, the downtrend may resume to $39 low. The bearish momentum may continue to drop to $38 after which the coin may reach a low of $36 and $34 if the previous support is broken.
More so, the Litecoin is about to enter into the oversold zone according to the stochastic RSI. This implies that LTC/USD is still in the bearish trend zone and it is likely to fall.
When compares with Bitcoin, LTC/BTC is still in a range and in a downward move. Meanwhile, the current movement describes that the buyers and sellers are undecided about the direction of the market. Any bullish movement above the 9-day and 21-day moving averages may reach the resistance levels at 4850 SAT and above.
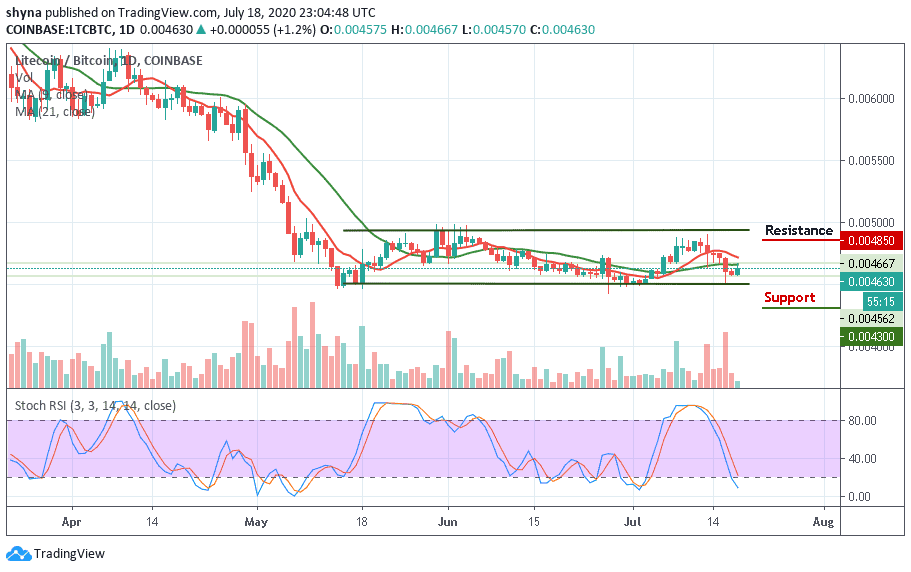
However, the stochastic RSI indicates that LTC/BTC is likely to follow a downward movement within the channel. Breaking below the lower boundary of the channel may cause the coin to reach the low of 4300 SAT and below. Meanwhile, the technical indicator is approaching the oversold zone which confirms the price is in the downtrend zone.
Join Our Telegram channel to stay up to date on breaking news coverage