Join Our Telegram channel to stay up to date on breaking news coverage
Bitcoin (BTC) Price Prediction – July 18
The price of Bitcoin clings to small recovery gains as the price stays below $9,200.
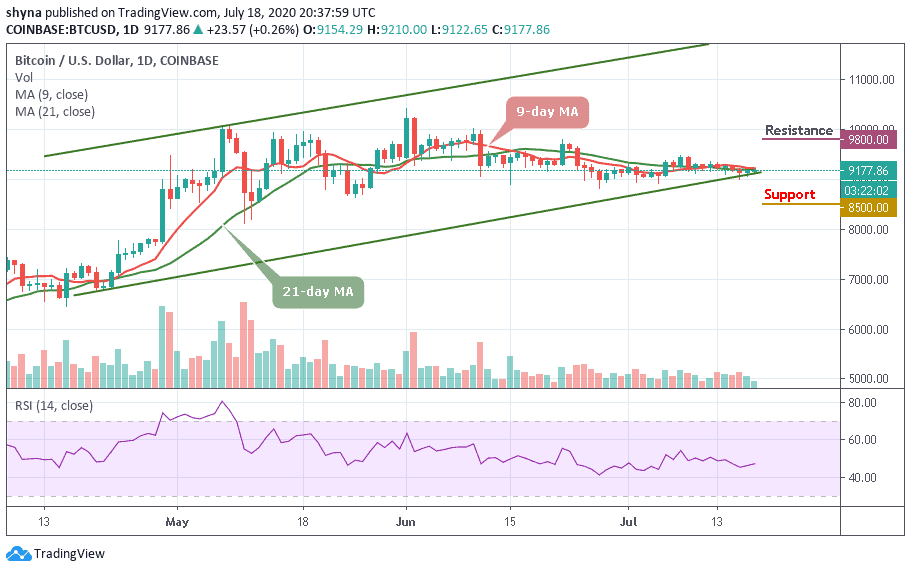
BTC/USD Long-term Trend: Ranging (Daily Chart)
Key levels:
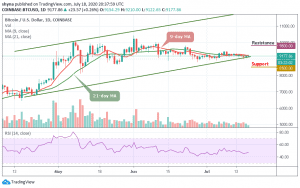
Resistance Levels: $9,800, $10,000, $10,200
Support Levels: $8,500, $8,300, $8,100
After posting a small daily gain yesterday, BTC/USD is relatively calm during the first trading session of today as the coin stages a modest rebound. However, BTC/USD struggles to preserve its bullish momentum to find resistance near $9,200. At the time of writing this, Bitcoin is up with 0.26% gains on the day at $9,177.86.
Meanwhile, the RSI (14) indicator on the daily chart stays very close to 50-level while BTC/USD is trading around the lower boundary of the channel, suggesting that the pair could have a tough time in posting any additional recovery gains as the critical supports lie at $8,500, $8,300, and $8,100 respectively. On the upside, $9,200 aligns as the initial resistance ahead of $9,400 and $9,796.91 which was June 22 high.
Moreover, the current level where the coin is trading is very important for the bulls and it is expected to be between $9,100 and $9,300 which could help the buyers to surpass the resistance of $9,400 and $9,600 level. Reaching these resistance levels may allow the Bitcoin price to touch $9,800, $10,000, and $10,200 resistance levels.
BTC/USD Medium-Term Trend: Bearish (4H Chart)
On the 4 hour chart, BTC/USD is seen touching the daily high of $9,210 resistance level. At the moment, the bulls could not sustain the upward move as price quickly makes a downward move. The most important thing is that the support level of $9,100 and $8,900 must hold for an upward movement.
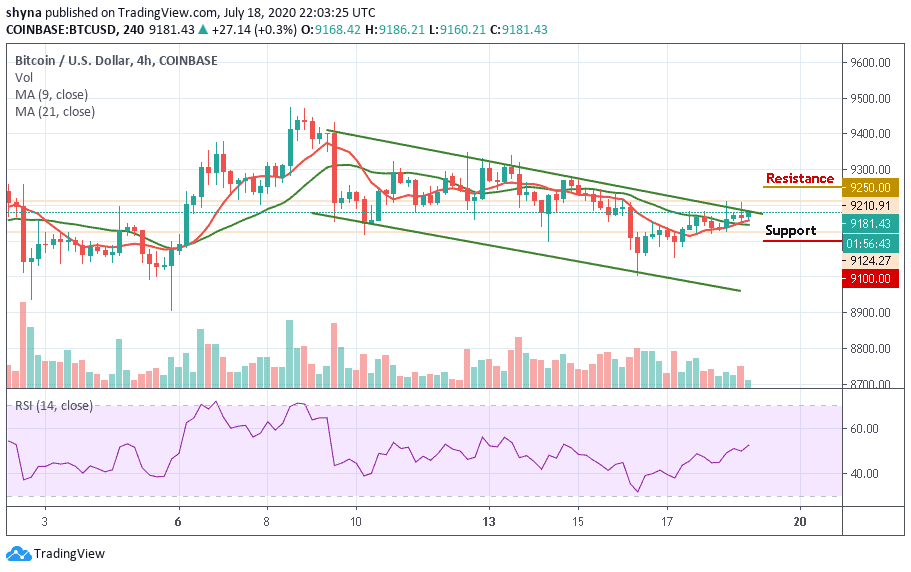
Today, after the rebound, Bitcoin reached a high of $9,210 but has fallen to $9,152 before peaking to where it is currently trading at $9,181.43. BTC/USD is presently trading above 50-level of the technical indicator RSI (14). It indicates that the market is in bullish momentum. The coin is expected to reach the resistance level of $9,250 and above if the current price breaks above the channel.
Join Our Telegram channel to stay up to date on breaking news coverage