Join Our Telegram channel to stay up to date on breaking news coverage
Litecoin Is Below $75 – July 29
The Litecoin market valuation is below $75 as it has been striving to surge higher from a lower-trading zone. The last thirty days of operations featured between 46.66 and $64.31. Price has a 3.02% negative as of writing
Litecoin (LTC) Statistics:
LTC price now – $61.68
LTC market cap – $4.4 billion
LTC circulating supply – 70.8 million
LTC total supply – 84 million
Coinmarketcap ranking – #21
LTC Trade Trades Below $75
Key Levels:
Resistance levels: $75, $85, $95
Support levels: $55, $45, $35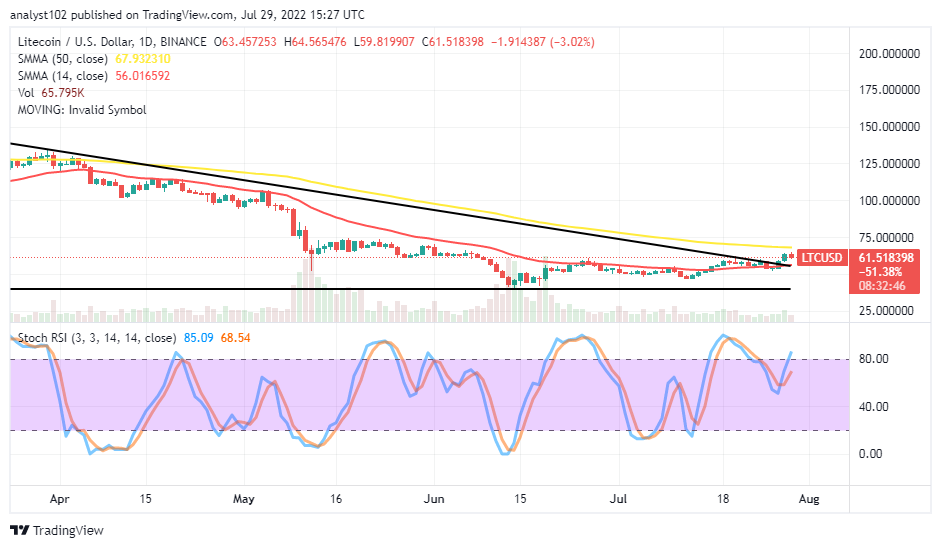 LTC/USD – Daily Chart
The daily chart reveals the LTC/USD price is below $75, not too far above the trend line of the smaller SMA. The 14-day SMA indicator is around $56 underneath the 50-day SMA indicator, which is at $67 or thereabout. The bearish trend line drew southward to give a high of $55 and a low of $40, marking the psychological points to the downside. The Stochastic Oscillators are attempting to move into the overbought region.
Will there be a resumption of downward-trending moves below the $68 resistance?
Today’s LTC/USD market operation has had a smaller bearish candlestick to signify a warning signal against having smooth up-runs past the trend line of the bigger SMA at around $67 resistance or thereabout as the crypto-economic price is below $75. At this injunction, long-position takers will be cautious of exerting new buying orders around the 50-day SMA even if the market tends to make a sharp breakout.
On the downside of the technical analysis, sellers may be getting a decent entry while the market makes a false breakout around the trend line of the 50-day SMA at $67 or the $75 resistance level afterward. Price seems to run into a correction toward a near point of the smaller SMA. The situation is not bagging high volatility to signify an aggressive downward motion.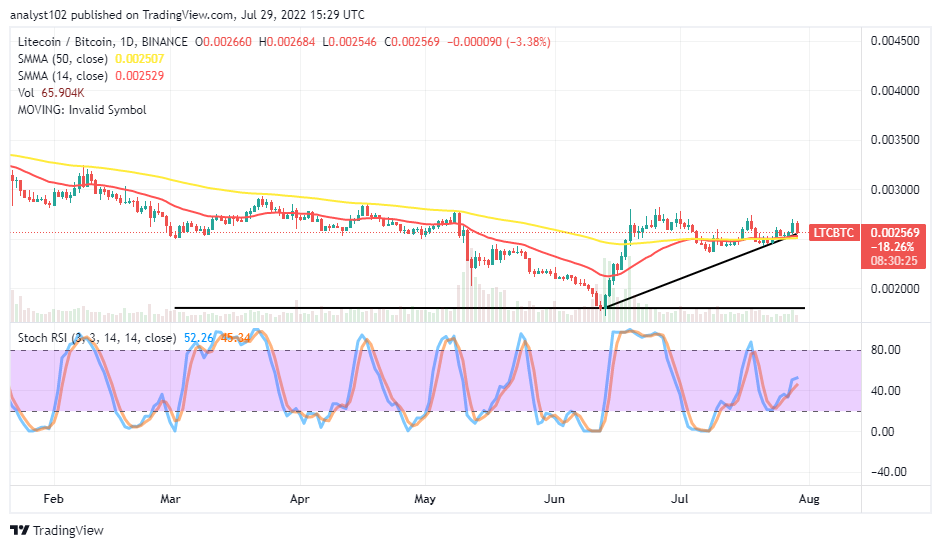
LTC/BTC Price Analysis
The pairing crypto market is below a higher resistance over the SMAs. Litecoin, in comparison to the trending weight force of Bitcoin, has remained holding higher against its counter trading instrument. The 14-day SMA indicator has conjoined with the 50-day SMA indicator at a higher-trading spot. A bearish candlestick forms downward toward the conjoining area of the two SMA trading indicators. The Stochastic Oscillators have slightly crossed northbound against the 40 range from the 20 range. The base crypto may have to push a bit down for a necessary correction before repositioning to swing upward back against its counter-trading instrument.
Read more:
Join Our Telegram channel to stay up to date on breaking news coverage