Join Our Telegram channel to stay up to date on breaking news coverage
Litecoin Holds Above $50 – July 24
The Litecoin price valuation holds above the $50 support line as the crypto economy prices around the $57 value line. The trade’s percentage rate is at 2.12 positives.
Litecoin (LTC) Statistics:
LTC price now – $57.61
LTC market cap – $4.1 billion
LTC circulating supply – 70.8 million
LTC total supply – 84 million
Coinmarketcap ranking – #20
LTC TradeHolds Above $50
Key Levels:
Resistance levels: $70, $80, $90
Support levels: $50, $40, $30
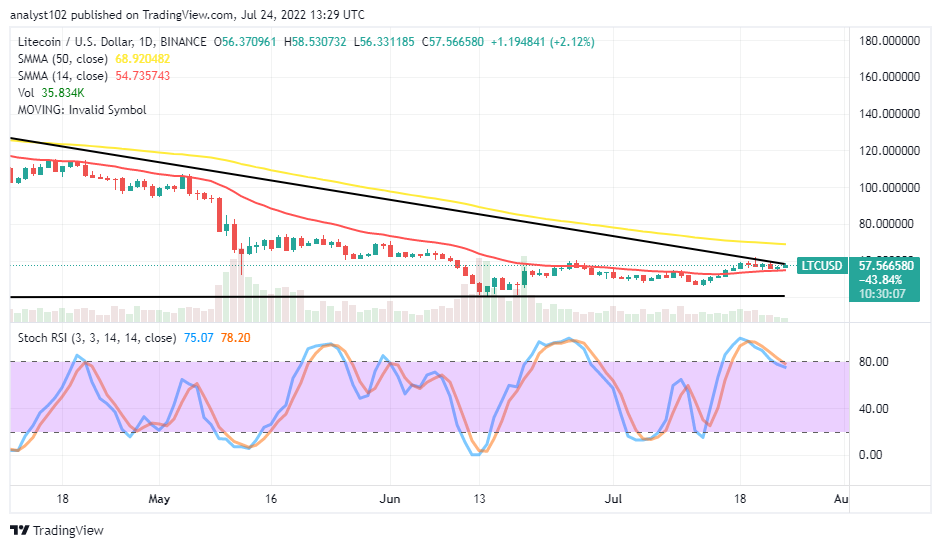
The LTC/USD daily chart showcases the crypto market holds above the $50 support level. The 14-day SMA indicator is around $54 underneath the 50-day SMA indicator. The horizontal line drew around the $40 support level to show where the critical baseline is. The Stochastic Oscillators have crossed southbound from the overbought region, briefly past the 80 range. Indications show the market moves in a less-active manner presently.
Will the LTC/USD price trade sustainably above the $50 level?
The LTC/USD trade may not be quickly pushing northward further as the crypto-economic market holds above the $50 support point. From the technical outlook, it appears price may soon be building up catalyst around the trend line of the 14-day SMA. However, traders intending to go for a buying position should be cautious, especially as there has been no tangible price action.
On the downside of the technical analysis, the LTC/USD market bears will have to push back the market down from underneath the 50-day SMA trend line at a $68 resistance level afterward. If the price has to reverse against the 14-day SMA indicator, sellers will push for lower points in the long-term run. There can be a range-bound-trading style involving $40,$50, and $60 points.
LTC/BTC Price Analysis
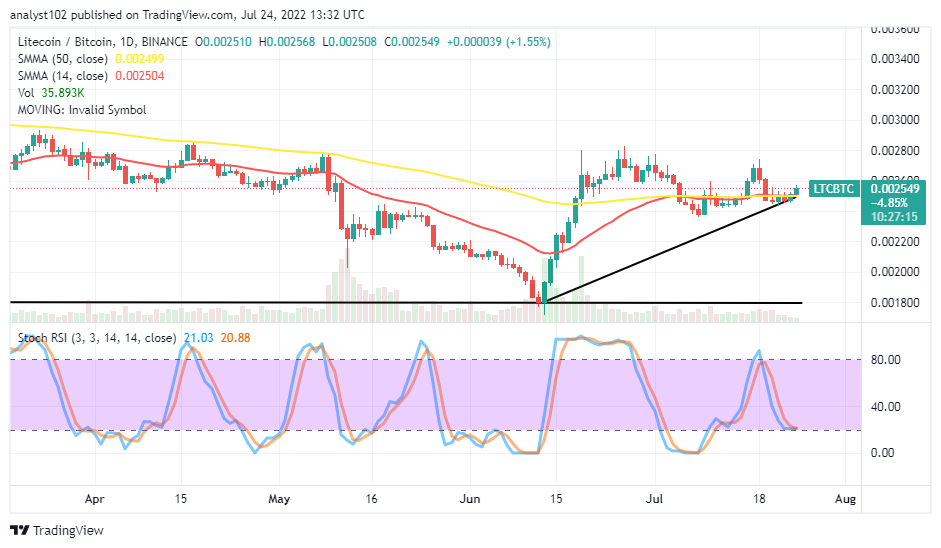
In comparison, Litecoin has consistently featured at a higher point against the trending capacity of Bitcoin. The cryptocurrency pair price holds above the trend lines of the SMAs. The 14-day SMA indicator has conjoined with the 50-day SMA indicator. The Stochastic Oscillators have traveled southbound and got closed around the range of 20. A smaller bullish candlestick is in the making to suggest the base crypto is striving to continue to hold its stances against the counter-trending of the latter crypto.
Read more:
Join Our Telegram channel to stay up to date on breaking news coverage


