Join Our Telegram channel to stay up to date on breaking news coverage
LTC Price Prediction – June 20
Litecoin (LTC) is seen trading under the moving averages, while the price of the cryptocurrency moves sideways.
LTC/USD Market
Key Levels:
Resistance levels: $48, $50, $52
Support levels: $38, $36, $34
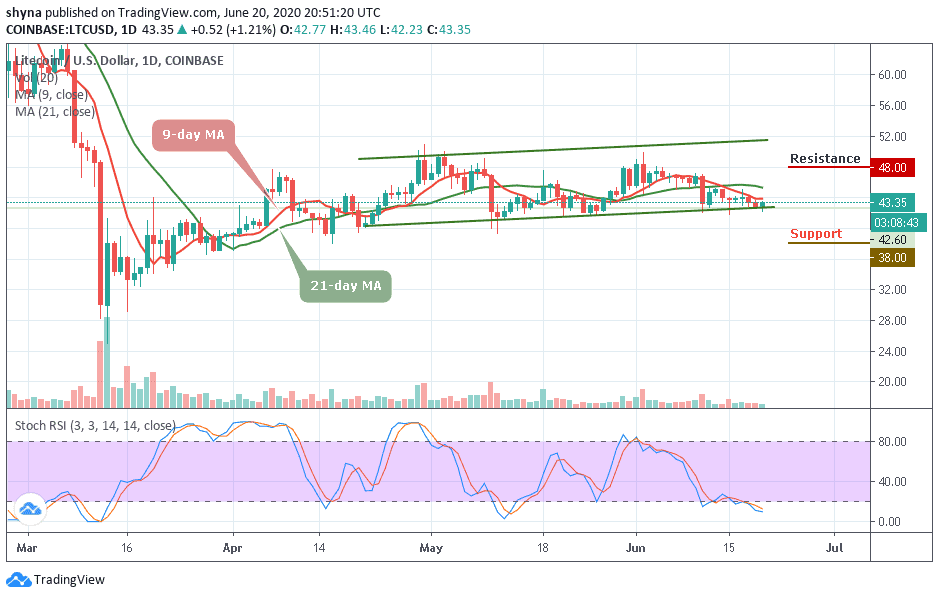
Looking at the daily chart, LTC/USD is still defending the support level of $42 again as the price hovers around $43.35. The coin is now moving under the moving averages, with a period of 9 and 21 indicating a sideways movement. For the time being, the market price is moving within the channel and the stochastic RSI indicator issues some bearish signals as it moves into the oversold zone.
Taking a look at the market, the LTC coin is yet to show a strong bear dominance in the long-term. But the short-term outlook still looks bullishly. However, a bullish interception may set the next key resistance at $48, $50, and $52, crossing the moving averages. Nevertheless, the coin could experience a little rise before the rally begins.
Following the on-going movement, the price of Litecoin has recently plunged to $42 before a small rise to where it’s currently changing hands at $43.35. A further bearish rally is likely at $38, $36 with a possible new monthly low at $34. As we can see on the daily price chart, LTC volume has been drastically low over the past days, which shows the bears may soon step back fully into the market.
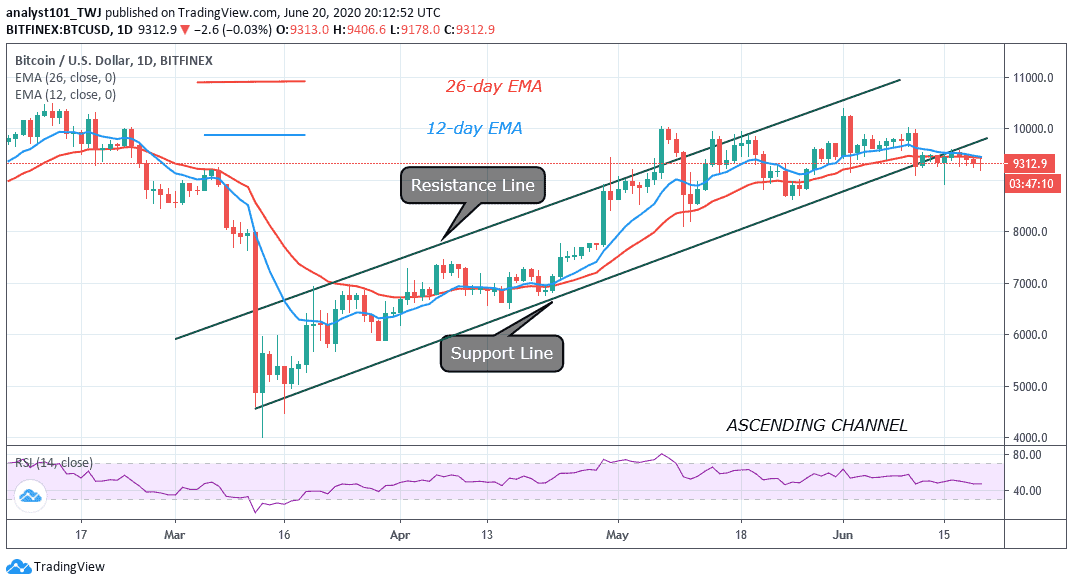
With Bitcoin comparisons, the market has evolved for a while in a very different way. For now, the sellers and buyers may need to decide who will take charge of the market as the market price moves under the moving averages while the stochastic RSI is coming out of the oversold zone, suggesting bullish signals.
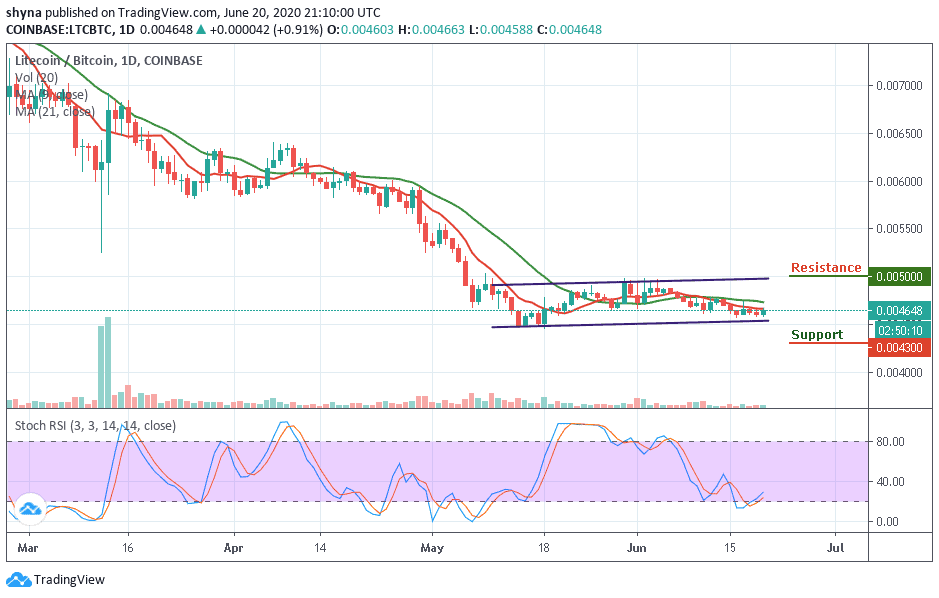
In other words, the downtrend may be giving the sellers some confidence to increase their entries. More so, if the bears succeeded in the broken price, one would expect the market to fall to the support level of 4300 SAT and below. Meanwhile, a rebound above the moving averages could increase it to the 5000 SAT and 5200 SAT BTC resistance level.
Join Our Telegram channel to stay up to date on breaking news coverage