Join Our Telegram channel to stay up to date on breaking news coverage
LTC Price Prediction – May 5
The price of Litecoin has dropped by 1.51% following the current bearish action that is going on in the market.
LTC/USD Market
Key Levels:
Resistance levels: $48, $50, $52
Support levels: $41, $39, $37

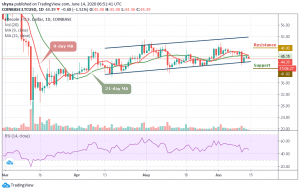
LTC/USD is currently trading below the 9-day and 21-day moving average but yet to reach the lower boundary of the channel. Yesterday, the Litecoin price touched the green-line of a 21-day moving average but now the LTC/USD pair is having a weak trading volume and the Litecoin price may continue to face bearish falls.
However, as the coin fails to recover from the current trading level, the more likely it is that we will see the cryptocurrency fall to a new trading low. A break below the $42 support level may provoke an even deeper decline towards the $41, $39, and $37 levels. The short-term technical analysis shows that the $43 and $44 levels are currently the strongest forms of technical support.
In other words, a break above the moving averages may propel Litecoin to hit the nearest resistance level at $47; a further push could take it to a high of $48, $50, and $52 resistance levels. As it stands now, the technical indicator RSI (14) moves toward the south which may likely cause the market to experience more bearish movement.
When compared with BTC, the Litecoin (LTC) is still trading on the downside within the symmetric triangle. The coin is also trading below the 9-day and 21-day moving averages at 4720 SAT and continues to fall through subsequent support level to 4700 SAT. The critical support level is located at the 4400 SAT and below.
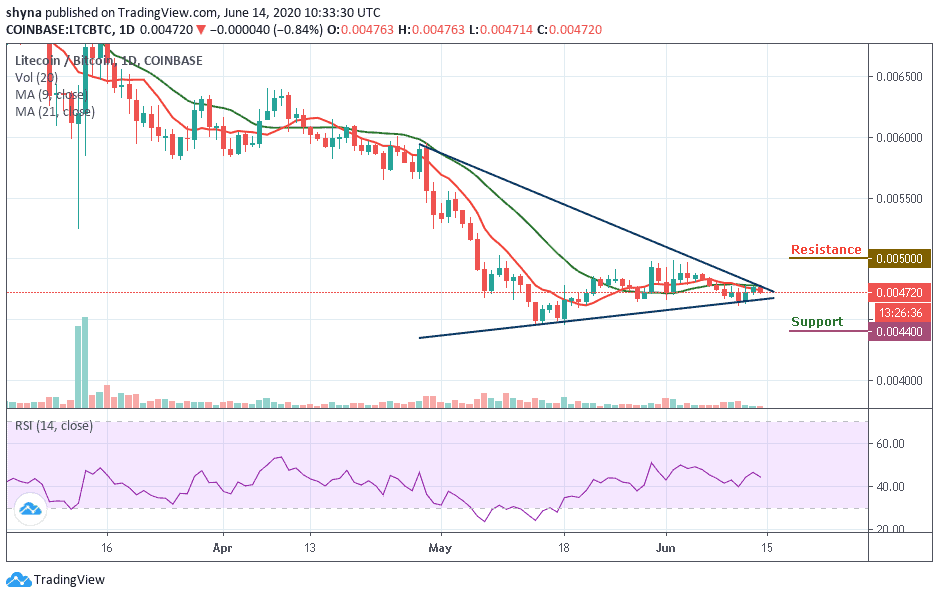
Nevertheless, if the bulls manage to re-group and power the market, traders may likely find the resistance level at 5000 SAT and above. Meanwhile, the green-line of 21-day is moving above the red-line of 9-day moving average which may cause the market to continue with the downward trend; a surge in volatility may occur as the RSI (14) moves below the 45-level, suggesting that more bearish signals may play out.
Please note: Insidebitcoins.com is not a financial advisor. Do your research before investing your funds in any financial asset or presented product or event. We are not responsible for your investing results.
Join Our Telegram channel to stay up to date on breaking news coverage