Join Our Telegram channel to stay up to date on breaking news coverage
Bitcoin (BTC) Price Prediction – June 14, 2020
Bitcoin bulls have made attempts to break above the $9,500 resistance but the bears are defending the upside range resistance zones. BTC/USD pair has since been trading marginally.
Key Levels:
Resistance Levels: $10,000, $11, 000, $12,000
Support Levels: $7,000, $6,000, $5,000
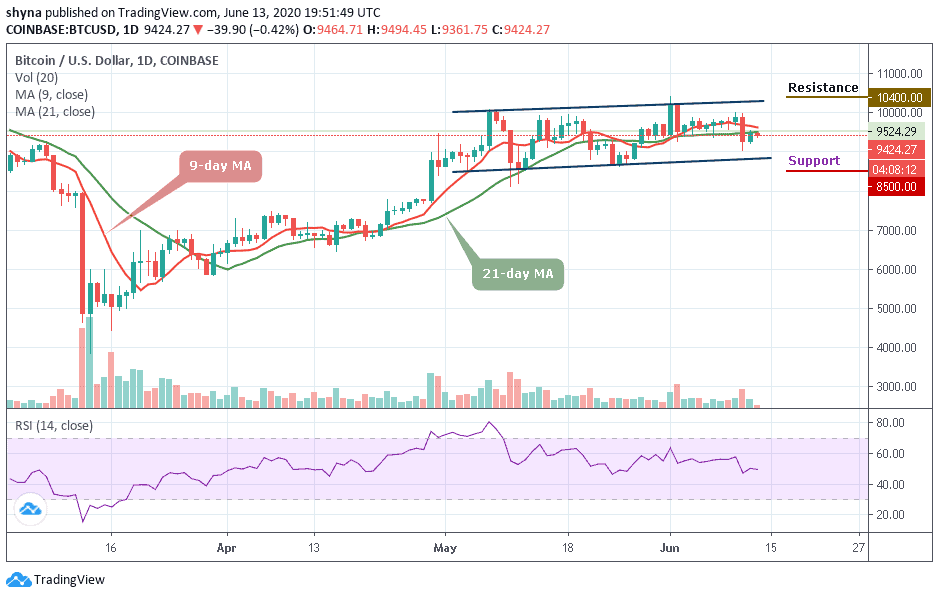
Bitcoin’s upside range consolidation in the $9,000 region has been ongoing since May 7. In the past month, buyers have made frequent attempts to break above the $10,000 overhead resistance. The repeated rejections at the $10,000 region has compelled BTC to fall and consolidate in the $9,000 region. Analysts believe that the recent rejection at $10,000 overhead resistance was created by miners who were moving BTC to exchanges before the recent selloff. Today, price has corrected upward but Bitcoin is trading marginally. The price movement has been insignificant.
In the meantime, buyers are attempting to push price above $9,500 resistance to resume the upside range. The king coin will rise if the bulls are successful above the $9,500 resistance. This will accelerate price movement between $9,400 and $9,800 before retesting the overhead resistance. The overhead resistance will be retested or broken above when the $9,800 and $9,880 resistances are cleared. Conversely, after consolidation BTC may resume a downward move if the bears break below $9,000 support. Bitcoin is likely to decline to $8,200 low. The Relative Strength Index period 14 is at level 49 indicating that price is in the downtrend zone. BTC tends to fall because it is below the centerline 50.
BTC/USD Medium-term Trend: Bullish (4-Hour Chart)
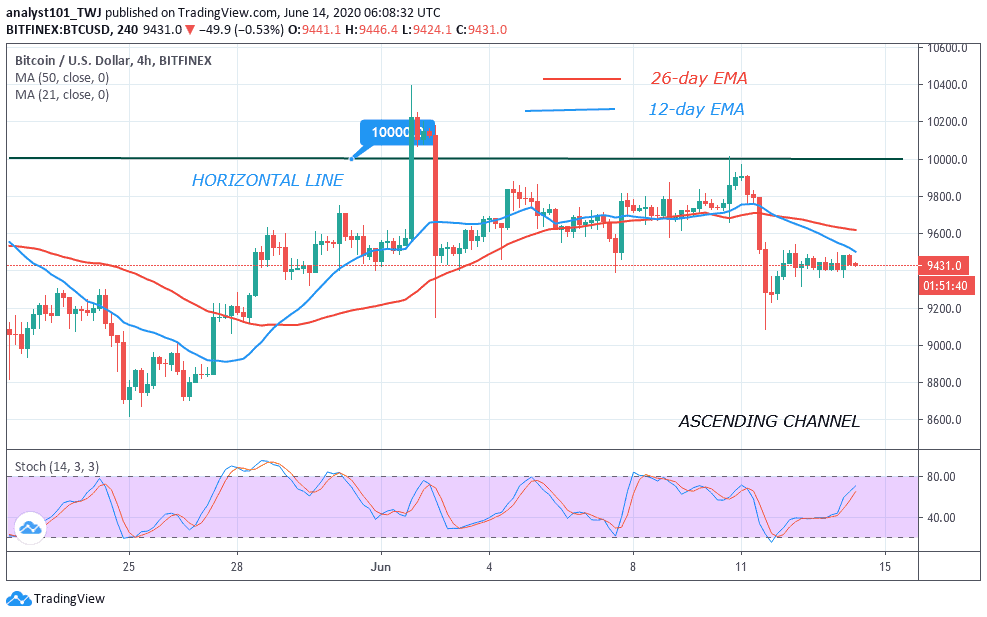
On the 4 hour chart, after price correction above $9,400, the price bars are indicating small body candlesticks. These are spinning tops and Doji candlesticks indicating that buyers and sellers are undecided about the direction of the market. At this point of consolidation, price can go either way. Bitcoin is above 40 % range of the daily stochastic indicating a bullish momentum.
Please note: Insidebitcoins.com is not a financial advisor. Do your research before investing your funds in any financial asset or presented product or event. We are not responsible for your investing results.
Join Our Telegram channel to stay up to date on breaking news coverage