Join Our Telegram channel to stay up to date on breaking news coverage
Bitcoin (BTC) Price Prediction – June 13
Today, the Bitcoin price loses traction after hitting $9,524; losses likely to continue in the near term.
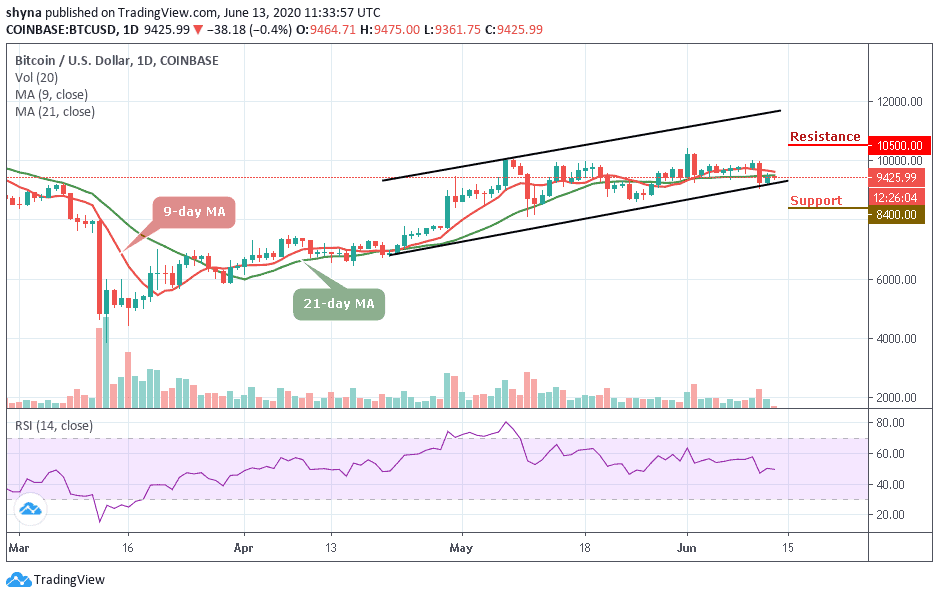
BTC/USD Long-term Trend: Ranging (Daily Chart)
Key levels:
Resistance Levels: $10,400, $10,600, $10,800
Support Levels: $8,500, $8,300, $8,100

After touching the intraday low of $9,345 level, BTC/USD is recovering to trade at $9,424 at the time of writing. Despite the recovery, the first digital asset has lost over 0.42 % since the start of the day amid strong bearish sentiments that replaced the optimism after a failed attempt to break above $10,000 in a couple of days ago.
However, from a technical perspective, we can easily see that BTC/USD is currently having a bearish bias. The technical indicator RSI (14), for instance, may soon be pointing to the south. More so, if the support at 50-level fails to hold and the indicator slumps, the losses may gain momentum towards $9,000. If the sell-off materializes, BTC/USD may retest $8,800.
Moreover, if the market continues with the downward trend, the Bitcoin price could drop to the nearest support at $8,800, and should this support fails to contain the sell-off; traders may see a further roll back to $8,500, $8,300, and critically $8,100. Meanwhile, any bullish cross above the 9-day and 21-day moving averages may reach the resistance at $10,400, $10,600, and $10,800 levels.
BTC/USD Medium-Term Trend: Ranging (4H Chart)
On the 4-Hour chart, BTC price hovers below the 9-day and 21-day moving averages around $9,431 which may take time to persistently trade above $9,500. In addition, if the bulls gather enough strength and regroup, the upward movement may be able to near the $9,600 and $9,800 resistance level.
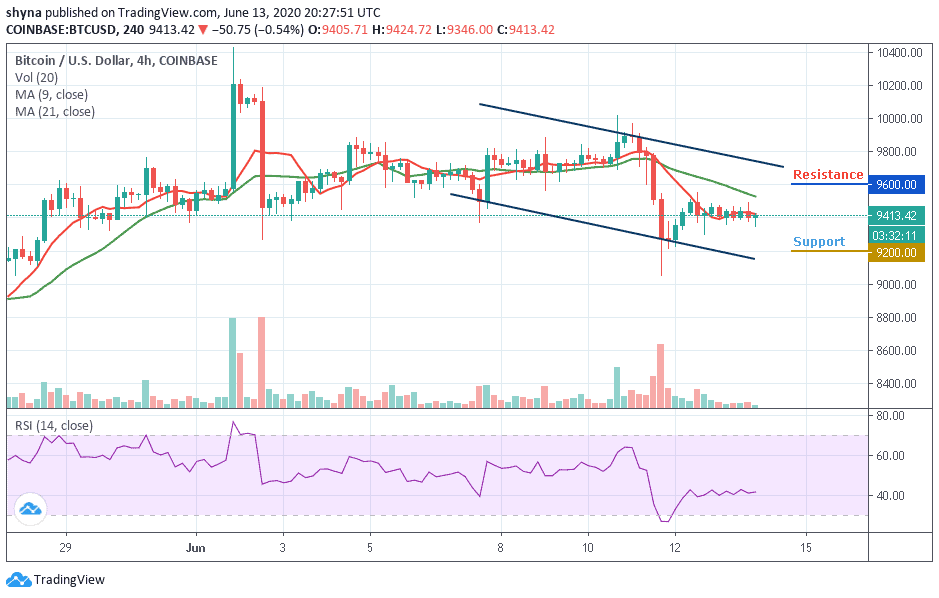
However, on the downside, immediate support is around the $9,400 level while the main support is at the $9,300 level. The price may likely fall below $9,200 if the bears step back into the market, a further movement could reach the critical support at $9,000 level. Technically, BTC/USD is still moving in sideways while the RSI (14) moves above 40-level, indicating an indecisive in the market movement.
Please note: Insidebitcoins.com is not a financial advisor. Do your research before investing your funds in any financial asset or presented product or event. We are not responsible for your investing results.
Join Our Telegram channel to stay up to date on breaking news coverage