

Join Our Telegram channel to stay up to date on breaking news coverage
Litecoin (LTC) Price Prediction – October 12, 2020
LTC/USD is now trading at $51 at the time of writing. The coin was previous range bound between $45 and $47. The breakout at the $47 resistance resulted in the price reaching the high of $51. The coin has broken above the moving averages which signal the resumption of bullish momentum. The LTC/BTC has been in a range-bound movement since September 21.
LTC/USD Market
Key Levels:
Resistance Levels: $80, $100, $120
Support Levels: $50, $40, $20

Since October 3, Litecoin has been range-bound between $45 and $47. October 8, the bulls broke the resistance at $47. After a retest above the $47 support, LTC continues its rally on the upside. The crypto has reached a high of $51. In the meantime, buyers are finding penetration difficult at the recent high. Therefore, LTC has resumed a sideways move below $51 resistance.
Buyers have retested this recent resistance twice but unable to break it. With the recent price surge, Litecoin is trading in the bullish trend zone. On the upside, a break above $51, will propel price to rise to the high of $63. If the bullish scenario fails the crypto will continue the sideways move.
Litecoin Indicator Analysis
LTC price has broken above the moving averages (SMAs). This indicates that the coin is likely to rise. The price has risen above the 80% range of the daily stochastic. This indicates that LTC is in a strong bullish momentum. The coin is also in the overbought region of the market. The crypto may experience a period of price fall.
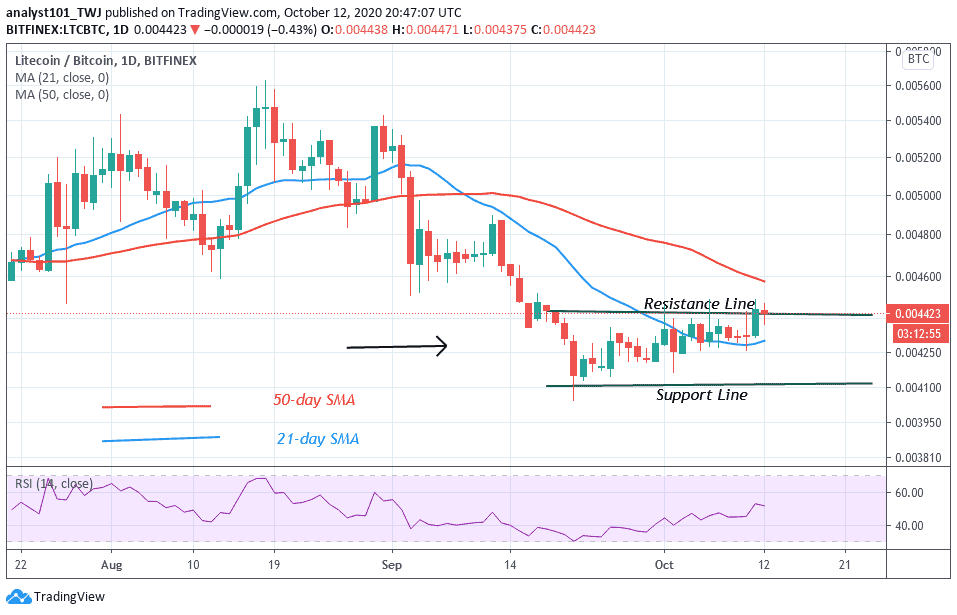
On the LTC/BTC chart, the coin is now range-bound in a horizontal channel. The crypto will either encounter a breakout that will propel the coin to resume an upward move. Similarly, a breakdown will mean a further downward movement of the coin. The Relative Strength Index of the coin is at level 51. It indicates that there is a balance between supply and demand.
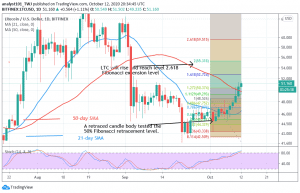
From the price action, the LTC/USD is likely to rise. In the recent uptrend of September 25, the retraced candle body tested the 50% Fibonacci retracement level. It indicates that the coin will rise and reach level 2.0 Fibonacci extension or $55.31 high.
Join Our Telegram channel to stay up to date on breaking news coverage
