Join Our Telegram channel to stay up to date on breaking news coverage
BCH Price Prediction – October 12
For the past 6 days, the Bitcoin Cash has been showing an amazing intraday hike as it rises from the low of $216 to currently trading above $240.
BCH/USD Market
Key Levels:
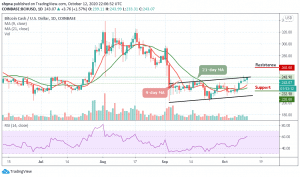
Resistance levels: $260, $270, $280
Support levels: $220, $210, $200

BCH/USD is currently pushing the market price above the important-resistance level. More so, the coin is hovering above $240 to trade at $243 at the time of writing. However, the BCH is seen focusing on the bullish momentum after a sustainable break above an important technical level. More so, the coin is trading above the 9-day and 21-day moving averages with 1.57% gains.
Where is BCH Price Going Next?
On the upside, if BCH/USD crosses above the upper boundary of the channel, the price may break through the resistance level of $245 and $255 respectively. Meanwhile, the technical indicator shows that the bulls are still in the action especially when the up-trending RSI (14) crosses above the 60-level. Any further bullish movement above the channel may pave the way the resistance levels of $260, $270, and 280.
In other words, if the price falls below 9-day MA, the market may be compelled either to a range-bound or begin a downward movement. If this happens, it may likely serve as a major blow for the market sentiments as traders could interpret it as a sign of underlying weakness. The next important support comes at $225, which may be followed by $220, $210, and $200 support levels.
When compares with Bitcoin, the Bitcoin Cash (BCH) is being weak due to a recurring bearish feeling which caused a drastic fall in the market. As the price drops, sellers pose an additional threat to buyers to reach the support level of 0.0207 BTC, where the closest target is located. However, a possible break under the moving averages may cause the coin to collapse.

Meanwhile, for an upward movement, 0.022 BTC and above is the main resistance level. Therefore, a negative peak could retest the major support at BTC 0.0197 and below. Nevertheless, the RSI (14) moves toward the 40-level, suggesting more bearish signs.
Join Our Telegram channel to stay up to date on breaking news coverage