Join Our Telegram channel to stay up to date on breaking news coverage
The Hedera price prediction is moving with an uptrend, and the traders could expect an early arrival of a price rally.
Hedera Prediction Statistics Data:
- Hedera price now – $0.065
- Hedera market cap – $1.48 billion
- Hedera circulating supply – 22 billion
- Hedera total supply – 50 billion
- Hedera Coinmarketcap ranking – #37
HBAR/USD Market
Key Levels:
Resistance levels: $0.075, $0.077, $0.079
Support levels: $0.053, $0.051, $0.049
Your capital is at risk
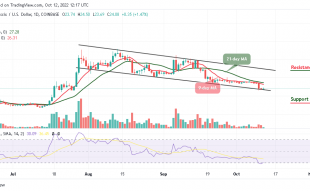
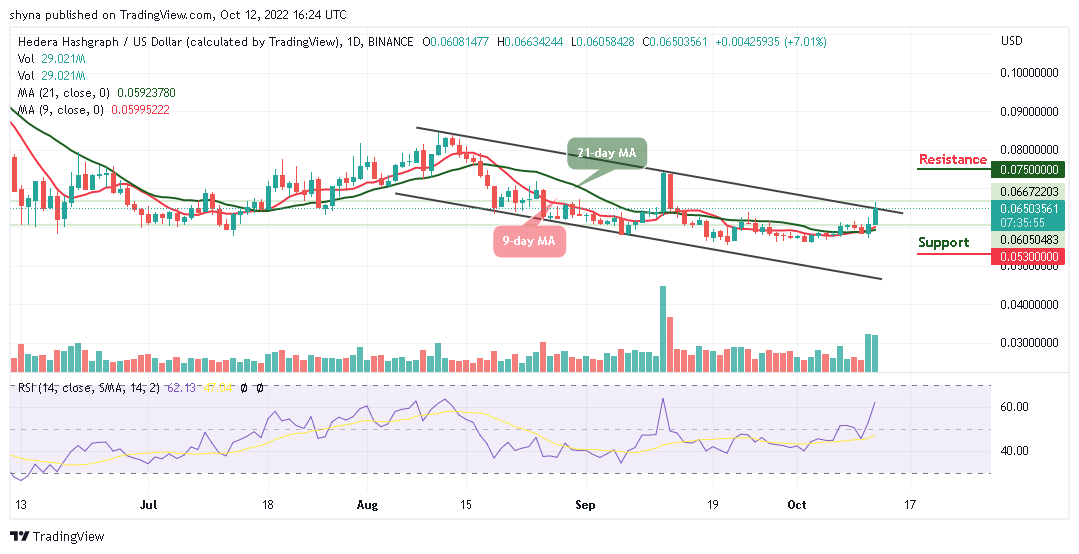
HBAR/USD is currently dealing with the bulls as the coin hovers above the 9-day and 21-day moving averages. The Hedera price has always sought to increase despite the pressure of the market. However, the crypto market is struggling with volatility, and the market will likely come out in the same way soon. The period after this one should be flourishing.
Hedera Price Prediction: HBAR Could Gain More Upwards
At the time of writing, the Hedera price continues to hold strong at $0.065, and it’s possible that the more the $0.060 support is tested, the more it’s likely to break to the downside. However, if HBAR/USD continues to abuse this level, the traders can expect the price to break beneath it at some point, and the critical support levels of $0.053, $0.051, and $0.049 may be tested.
For now, the Hedera price is hovering around $0.065 with the weak bullish momentum supported by the slightly positive technical levels. Therefore, any further bullish movement could hit the resistance levels at $0.075, $0.077, and $0.079 respectively. The technical indicator Relative Strength Index (14) is crossing above the 60-level to increase the bullish movement.
When compares with Bitcoin, HBAR has been grinding higher tremendously. The market price is hovering above the 9-day and 21-day moving averages. The Hedera price is now contained within the channel as traders wait for the bulls to hopefully push the market higher while the technical indicator Relative Strength Index (14) moves to cross into the overbought region.
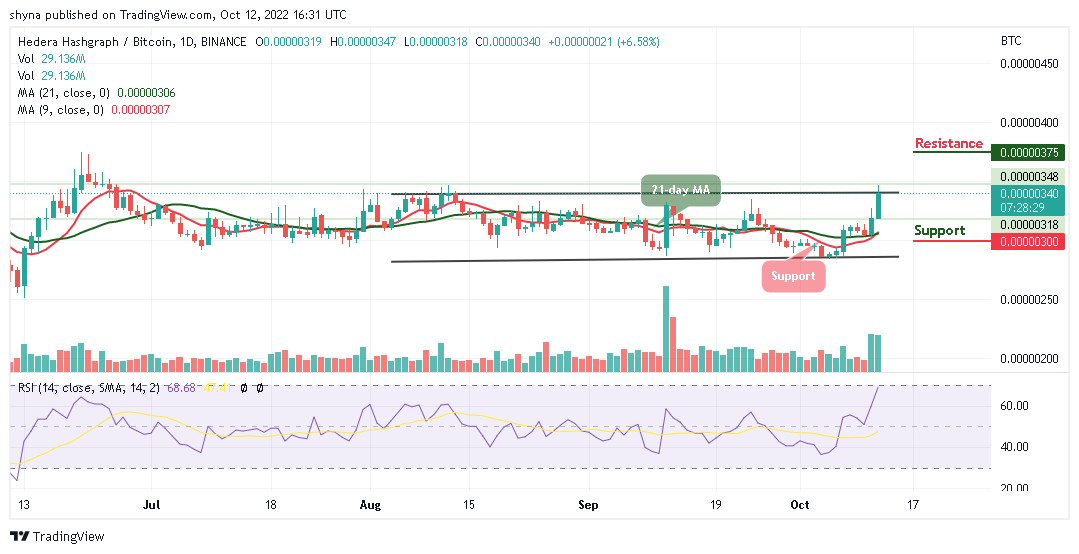
Moreover, if the bulls can break out above the upper boundary of the channel, traders can expect initial resistance at 350 SAT. Above this, higher resistance could be located at 375 SAT and above. From below, if the sellers bring the market beneath the 9-day and 21-day moving averages, traders can expect critical support at 300 SAT and below.
Join Our Telegram channel to stay up to date on breaking news coverage