
Join Our Telegram channel to stay up to date on breaking news coverage
As the coin grows to the upside, the Hedera Hasgraph (HBAR) price prediction is likely to move consistently within the channel.
Hedera Hasgraph Prediction Statistics Data:
- Hedera Hasgraph price now – $0.067
- Hedera Hasgraph market cap – $1.43 billion
- Hedera Hasgraph circulating supply – 21 billion
- Hedera Hasgraph total supply – 50 billion
- Hedera Hasgraph Coinmarketcap ranking – #41
HBAR/USD Market
Key Levels:
Resistance levels: $0.080, $0.090, $0.100
Support levels: $0.055, $0.045, $0.035
Your capital is at risk
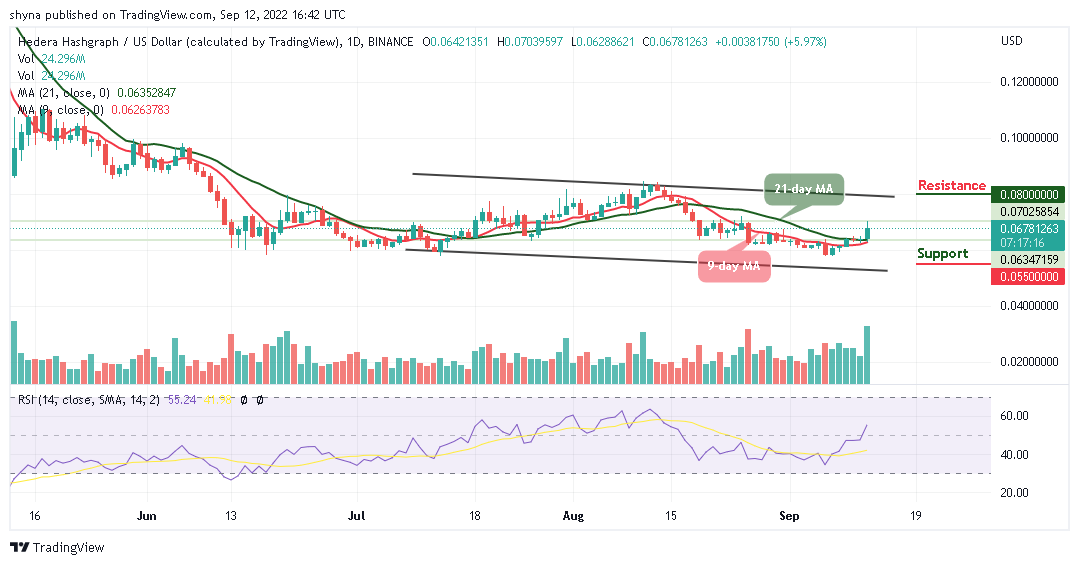
According to the daily chart, HBAR/USD is likely to stay above the 9-day and 21-day moving averages. In the last few days, the Hedera Hasgraph price has been struggling to cross into the positive side. As revealed by the daily chart, the technical indicator Relative Strength Index (14) is moving to cross above the 60-level, confirming the bullish movement for the coin.
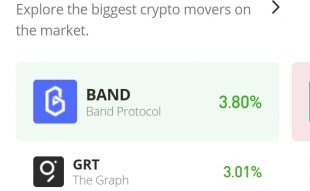
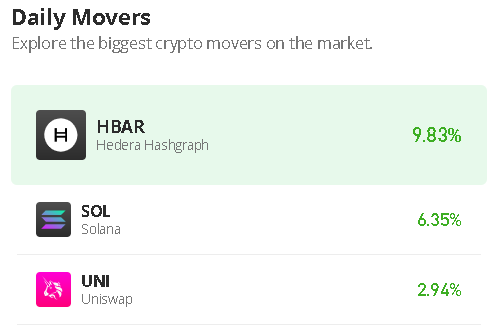
HBAR Price Ready for the Upside as Buyers Prefer TAMA
As the daily chart reveals, the Hedera Hasgraph price is currently moving to the north. If the coin continues with the bullish movement, the bulls may cross above the upper boundary of the channel to hit the resistance levels of $0.080, $0.090, and $0.100. At the time of writing, HBAR/USD shows a slight bullish movement within the daily chart.
On the contrary, if the coin slide below the 9-day and 21-day moving averages, it could return the coin to the support levels of $0.055, $0.045, and $0.035 respectively. Meanwhile, the long-term buyers should not be bothered by the small impact on the road, as the future of HBAR is assured as revealed by the technical indicator Relative Strength Index (14).
Against Bitcoin, the Hedera Hasgraph price is hovering within the 9-day and 21-day moving averages as the coin moves to cross into the positive side. The technical indicator Relative Strength index (14) is also confirming the bullish movement as the signal line moves to cross above the 50-level. On the contrary, a possible fall may surface if the technical indicator turns and faces downward, and it may likely cross below the lower boundary of the channel to hit the support level of 280 SAT and below.
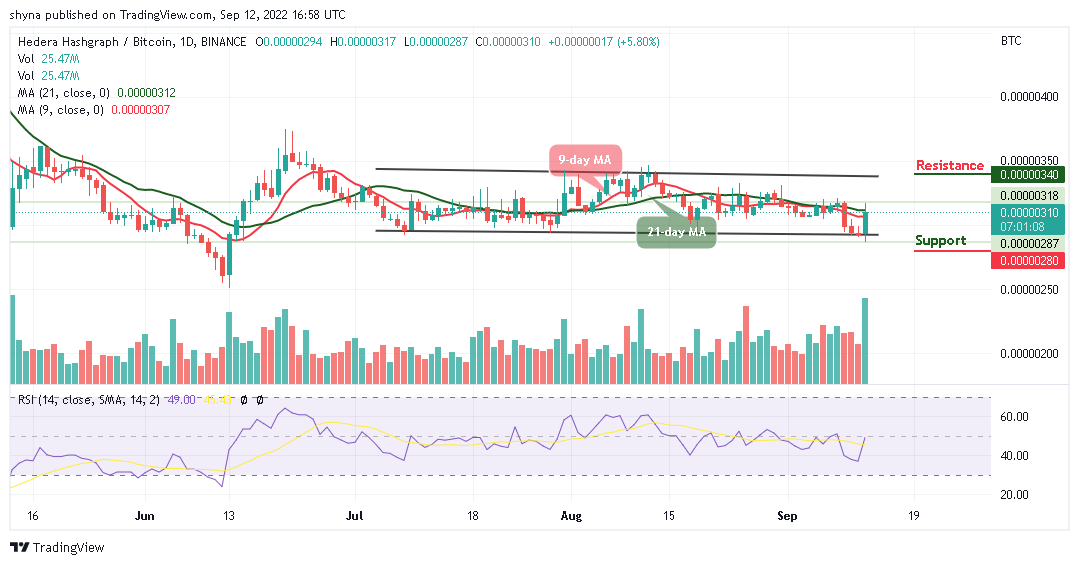
Meanwhile, any further bullish movement above the moving averages could push the coin to the resistance level of 340 SAT and above, this could take the coin to a new high and the market may remain in the bullish zone for a while.
The Tamadoge team said that the move aims to make investing in TAMA easy and safe. These users can be confident in transferring fiat into crypto, hence the need for Tamadoge to secure this deal with Transak. One of the strongest pillars of any project in the web 3.0 & crypto sector is having a solid team to see the project succeed. The TAMA website has revealed Thomas Seabrook as the Tamadoge lead developer and Carl Dawkins as the head of growth. The other members of the Tamadoge team include Neil Palethorpe and Siphamandla Mjoli, who have joined as the Senior Interaction Designer and the Senior Blockchain Developer, respectively.
Related:
Join Our Telegram channel to stay up to date on breaking news coverage