Join Our Telegram channel to stay up to date on breaking news coverage
Despite the Yesterday’s aggressive pull on both sides by the two market stakeholders, BAND/USD is trying to find an upward direction. Bulls are showing more strength bears and determination to continue the uptrend. After the bearish trend price consolidated briefly, the price finds an upward direction. Yesterday’s market was a tug-of-war as the sellers tries to block and change the trend in their favour, but the buyers were stronger than. This resulted into the price closing very near the open price.
The Grapth Market Price Statistic:
- GRT/USD price now: $0.1195000
- GRT /USD market cap: $ 821,924,813
- GRT /USD circulating supply: 6,900.000.000
- GRT /USD total supply: 10,000,000,000
- GRT /USD coin market ranking: #56
Key Levels
- Resistance: $0.13000, $0.14000, $0.15000
- Support: $ 0.10000, $0.09000, $0.08000
Your capital is at risk
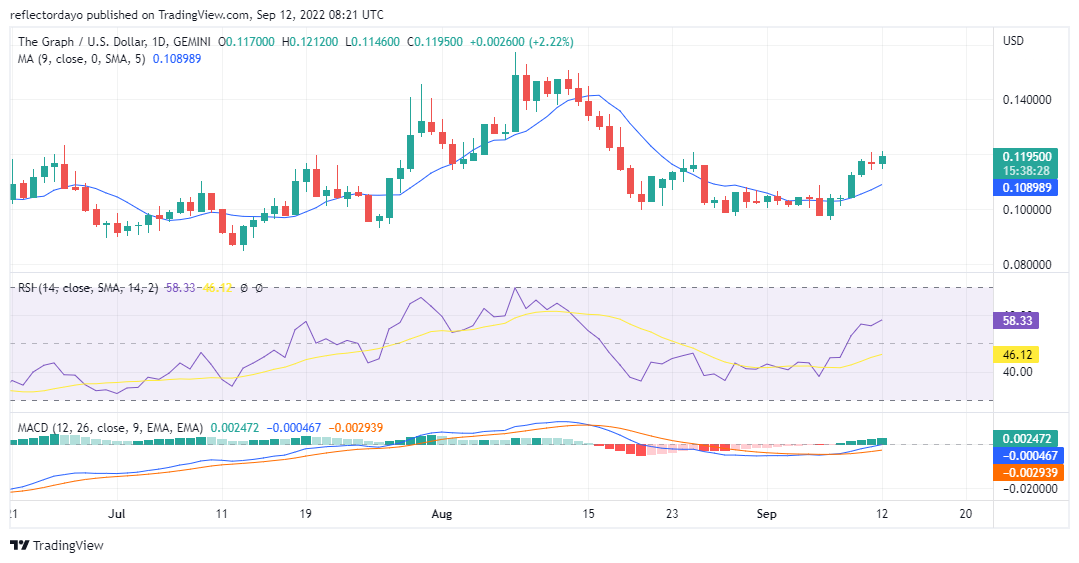
The Graph Market Price Analysis: The Indicators’ Point of View
The market price consolidation was broken on the 8th of September when both bullish strength and bearish strength matches each. The market for that was at first very bullish before bears takes control then bulls became strong enough to take back the market. But at the end of the day, they brought the price back to starting point. According to the Relative Strength Index, the market price is now in favour of bulls as it measures 58%. The RSI signal line is also trying to find an upward price level although it is still on the downside of the indicator. The MACD indicator indicates a progressive advancement in the trend. The green histograms signifies that the bullish momentum is still strong and the price may further rise.
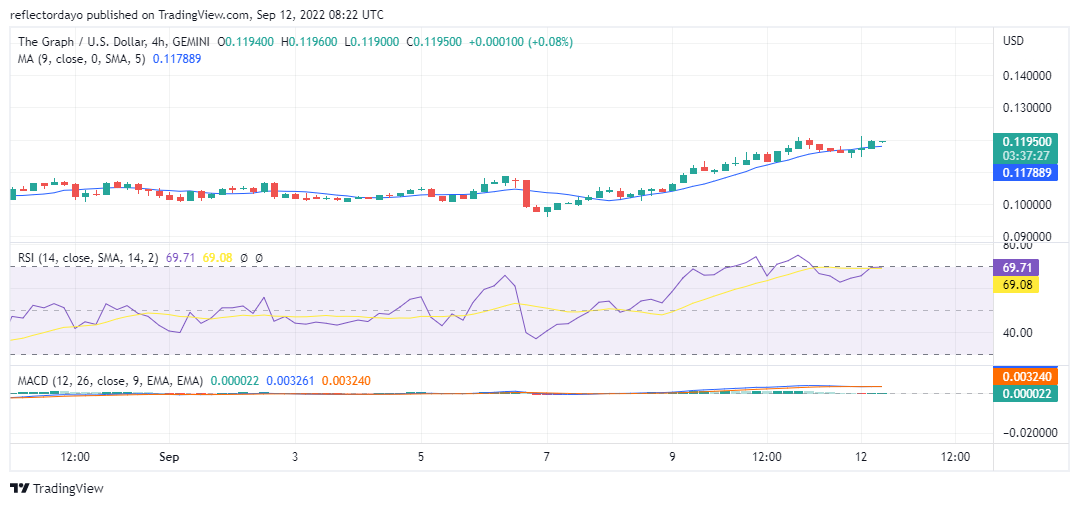
The Graph: GRT/USD 4-Hour Chart Outlook
The smaller timeframe make the bullish strength come clearer as we can observe the progressive advancement of price above the upward 9-day moving average. The Relative Strength Index line have risen progressively and then continue on an horizontal pattern on the edge of the overbought region. It moves at 69%; refusing to enter the overbought region. The probability that the price will continue high.
Related
Join Our Telegram channel to stay up to date on breaking news coverage