Join Our Telegram channel to stay up to date on breaking news coverage
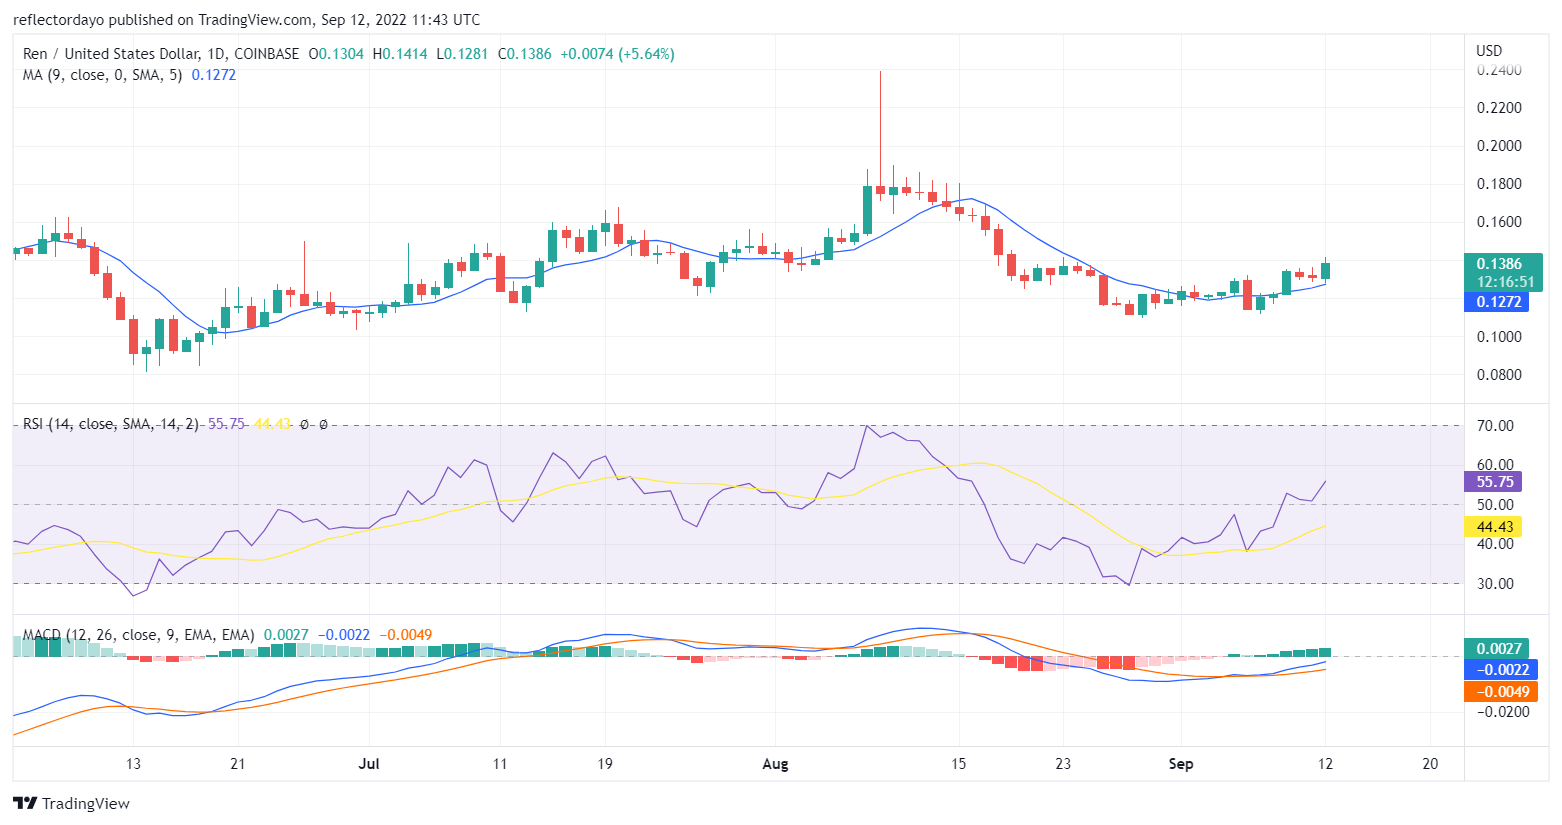
On the 9th of September, the REN/USD market broke above the 9-day moving average. This bullish daily market session confirms the change in the trend as it took the price to $0.1337. Sellers in the next two days showed enough aggression to prevent any further upward drive of the price by the sellers. However, in those two days, buyers showed a measure of strength against the sellers to minimize much of the price downward push. Today, they have picked up on their momentum to continue to drive the market price up. And in today’s market, price action is testing the $0.1400 price resistance level.
Ren Market Price Statistic:
- REN/USD price now: $54.74
- REN /USD market cap: $404,707,611
- REN/USD circulating supply: 7,261,273.87
- REN/USD total supply: 10,000,000
- REN/USD coin market ranking: #95
Key Levels
- Resistance: $56.00 $57.00 $ 58.00
- Support: $54.00, $53.00, $52.00
Your capital is at risk
Ren Market Price Analysis: The Indicators’ Point of View
According to the Moving Average Convergence and Divergence, the upswing had started on the 5th of September as the bullish histogram confirms the MACD line crossing of the previous day. On the 4th of September, the faster line of the MACD crossed the slower line MACD to signal a change of the trend from downward to upward. Apart from the setback on the 6th of September, the histograms are progressive up till today. In the RSI indicator, the RSI line made a quick downward retracement to test the signal line before it continues its upward movement, measuring 54.76% at the moment.
Ren: REN/USD 4-Hour Chart Outlook
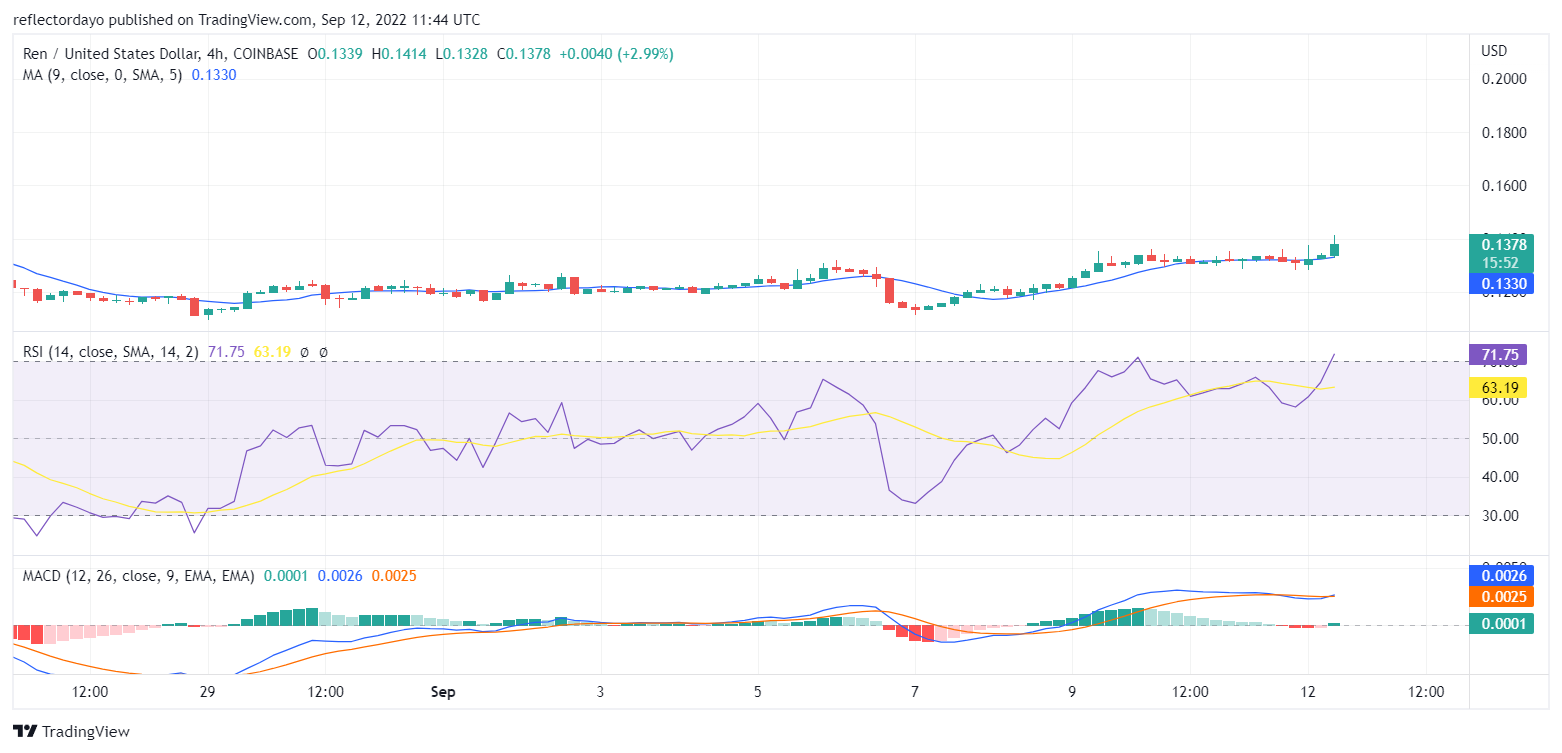
The bullish momentum slowed down in the second half of yesterday’s daily trading session as bears became strong enough to take the control of the market. But as today’s trading session was opening, it opened to favour the bulls. The MACD reflected the reduction in the bullish momentum that took place between yesterday and today. It also shows that the bulls are regaining strength, as the MACD line has crossed slightly to the upward side of the MACD line. The RSI line only showed a correction from the overbought territory. It is still maintaining the upward trend sentiment. The price of Ren may soon break the $0.1400 resistance level.
Related
Join Our Telegram channel to stay up to date on breaking news coverage


