Join Our Telegram channel to stay up to date on breaking news coverage
Fetch.ai Price Prediction – October 15
As of the time of writing this analytics for the FET/USD market, the crypto economy elongates lower highs around the smaller tool, which usually suggests an early determining condition of business activities between the pairing instruments. Price is trading around 40.08178207 at an average percentage rate of 1.52 positive.
FET Price Statistics:
FET price now – $0.08178207
FET market cap – $61.6 million
FET circulating supply – 746.1 million
FET total supply – 1.2 trillion
Coinmarketcap ranking – #320
FET/USD Market
Key Levels:
Resistance levels: $0.100000, $0.125000, $0.150000
Support levels: $0.050000, $0.040000, $0.030000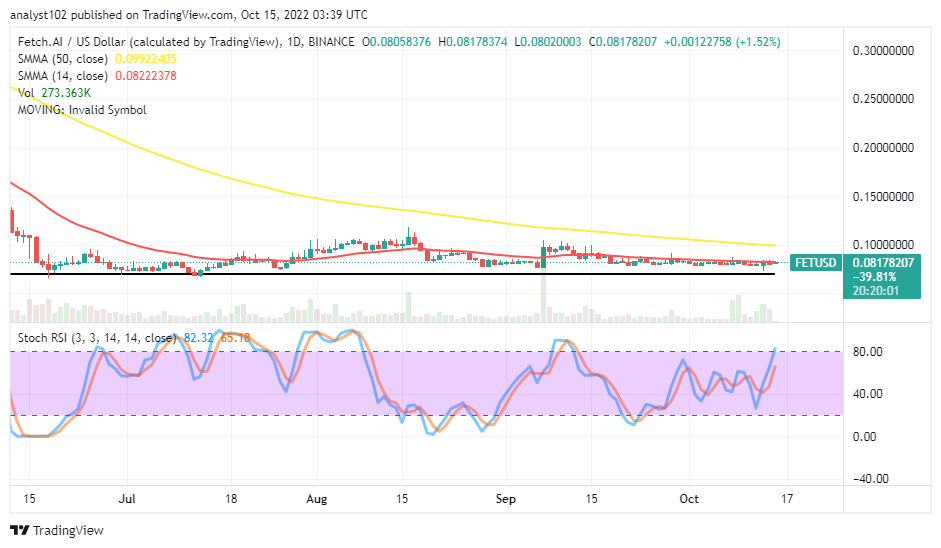 FET/USD – Daily Chart
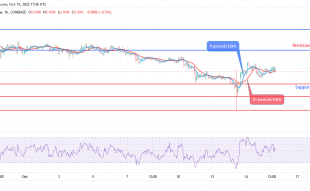
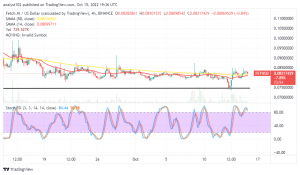
The FET/USD daily chart showcases the crypto-economic market elongates lower highs around the trend line of the smaller SMA. The 14-day SMA indicator is at $0.08222378, underneath the $0.09922405 of the 50-day SMA indicator. The Stochastic Oscillators have swerved from the range of 40 to 65.18 and 82.32 range values. The horizontal line drew around $0.050000.
Your capital is at risk
Will the FET/USD market change direction from being lowering highs soon?
There has been little to expect from the nature of upward-moving attempts the FET/USD market has been making to elongate lower highs around the 14-day SMA trend line. Presently, lots of indecision situations tend to play out for a while to sometime look as if bulls will strike. From the technical point of view, there will be a need for correction to occur toward the horizontal line before exerting a buying order afterward.
On the downside of the technical analysis, the FET/USD trade sellers may wait for the aftermath reading outlook of the Stochastic Oscillators in or around the overbought region to give an insightful sign to suggest a change of direction to back a downward force before going to launch a shorting position order. Bears should be wary of the price breaking out aggressively at the resistance point of $0.100000.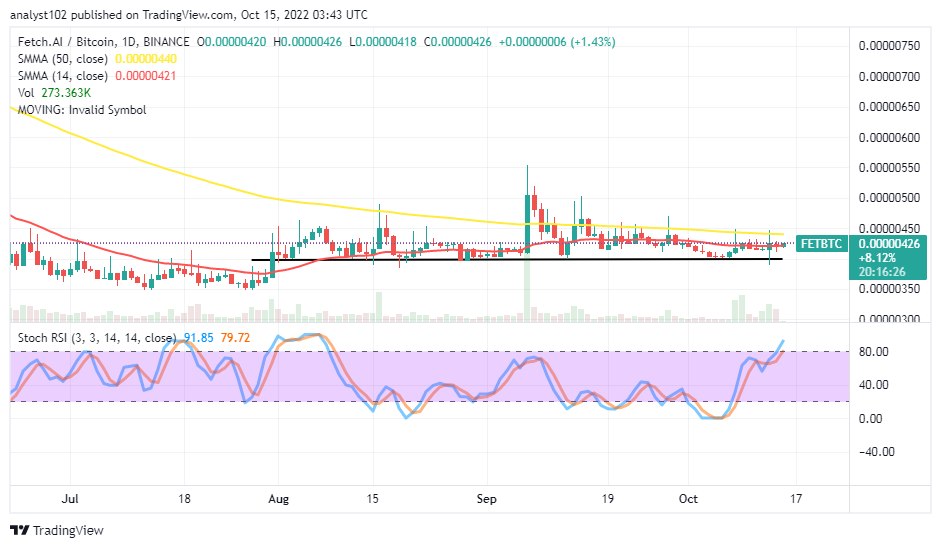
FET/BTC Price Analysis
Fetch.ai relatively holds stronger against Bitcoin at a high-trading spot in a manner of ranging. It closely connotes that the pairing crypto price may elongate lower highs around the smaller SMA trend line. The 14-day SMA indicator is underneath the 50-day SMA indicator. The Stochastic Oscillators are around the 80 range zone to push northbound at 79.72 and 91.85 range points to uphold the relative pace the market attempts northwardly. The level of price compliance in the following upswings is to be low.
Read more:
Join Our Telegram channel to stay up to date on breaking news coverage