Join Our Telegram channel to stay up to date on breaking news coverage
The Fantom price prediction is at $0.53 as the technical indicator Relative Strength Index (14) stays within the overbought region.
Fantom Prediction Statistics Data:
- Fantom price now – $0.53
- Fantom market cap – $1.4 million
- Fantom circulating supply – 2.7 billion
- Fantom total supply – 3.1 billion
- Fantom Coinmarketcap ranking – #40
FTM/USD Market
Key Levels:
Resistance levels: $0.70, $0.75, $0.80
Support levels: $0.35, $0.30, $0.25
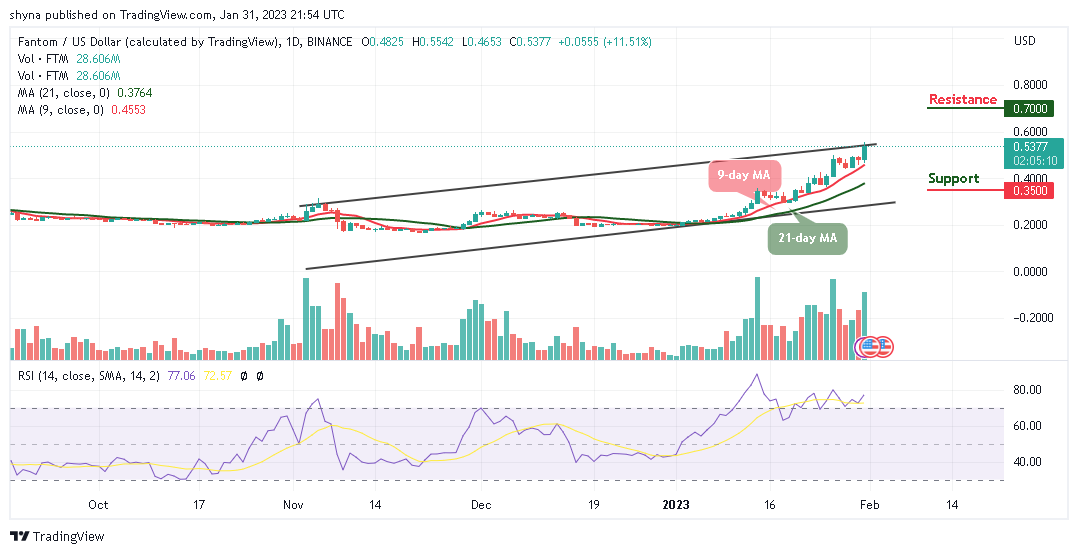
FTM/USD is trading around $0.53, and once it manages to surpass the potential resistance of $0.55, the next target is located at $0.60 where it could trade above the upper boundary of the channel. However, a push from here could send the price straight to around $0.65, but if the current level fails to hold strong, the Fantom (FTM) price could slip below the support level of $0.45.
Fantom Price Prediction: Is Fantom Ready for the Upside?
Looking at the daily chart, the Fantom bulls are coming back into the market, if the buyers keep the Fantom price above the 9-day and 21-day moving averages, FTM/USD may cross above the channel to hit the resistance levels of $0.70, $0.75, and $0.80 respectively. In addition, any bullish movement above these key resistance levels may encourage further buying.
In other words, any bearish movement below the moving averages may touch the critical supports at $0.35, $0.30, and $0.25. Meanwhile, looking at the technical indicator Relative Strength Index (14), Fantom may exhibit the tendencies to follow an upward trend as the signal line moves above the 70-level, suggesting that the market may create additional bullish trends.
When compares with Bitcoin, the Fantom price may cross above the upper boundary of the channel to hit the resistance level of 2600 SAT. Therefore, unless this resistance effectively holds and the price ends up closing above it, there might not be any reason to expect a bearish movement.
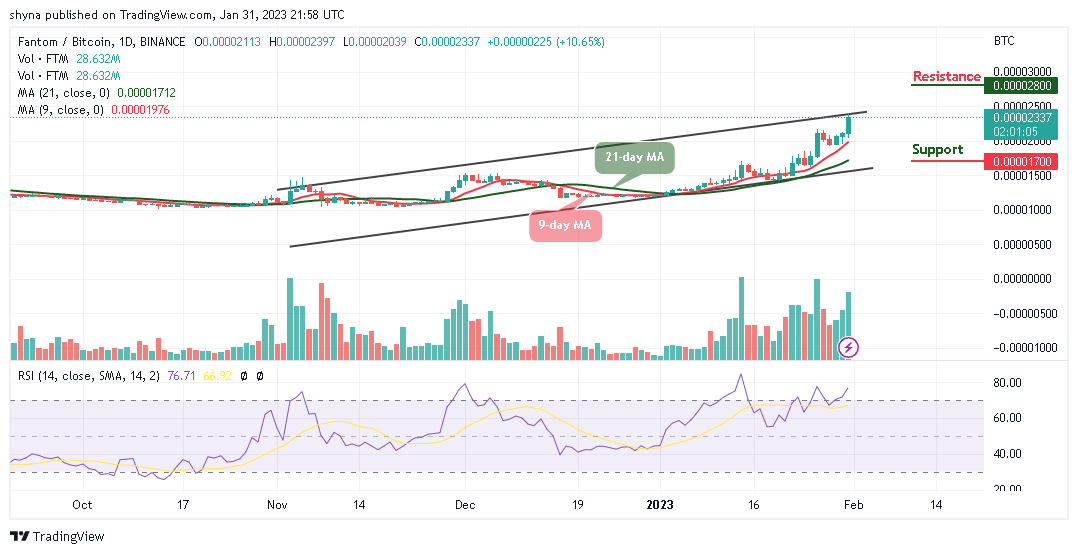
Should that be the case, if the coin decides to follow the bearish movement, it could refresh lows under 2000 SAT. Therefore, a possible bearish continuation may meet the major support at 1700 SAT and below. Meanwhile, if the coin crosses and stays above the channel, it could touch the potential resistance at 2800 SAT and above. Moreover, the technical indicator Relative Strength Index (14) moves into the overbought region, suggesting more bullish signals.
Fantom Alternatives
At the time of writing, the Fantom price is trading bullishly as the coin hits the resistance level of $0.55. The coin is one of the trending coins in the crypto market. However, the Meta Masters Guild (MEMAG) is another crypto that benefits traders. This token is this year’s Play-to-Earn guild with the fastest growth. As a result, it will be Web3’s largest mobile gaming guild. It is possible to develop games that are entertaining and intriguing and work with NFTs. And there, community members receive rewards for their investments and speculation. There has already been close to $2.5 million raised during the MEMAG presale.
Read more:
- USDCAD May Reverse at $1.3111 Level
- ADA Price May Retest Previous Low of $0.41 Level, The Sky Is the Beginning for TAMA
Join Our Telegram channel to stay up to date on breaking news coverage