
Join Our Telegram channel to stay up to date on breaking news coverage
As the coin grows to the upside, the dYdX price prediction is likely to move consistently within the channel as the coin heads to the upside.
dYdX Prediction Statistics Data:
- DYDX price now – $3.0
- DYDX market cap – $469.4 million
- DYDX circulating supply – 156.2 million
- DYDX total supply – 1 billion
- DYDX Coinmarketcap ranking – #80
DYDX/USD Market
Key Levels:
Resistance levels: $4.0, $4.4, $4.6
Support levels: $1.5, $1.3, $1.1

According to the daily chart, DYDX/USD could stay above the 9-day and 21-day moving averages if the bulls increase the buying pressure. In the last few days, the dYdX price has been moving positively. On that note, the technical indicator Relative Strength Index (14) is moving within the overbought region, confirming the bullish movement for the coin.
dYdX Price Prediction: DYDX Price Could Rally Further to $3.5
As the daily chart reveals, the dYdX price is currently moving to the north, aiming to cross above the upper boundary of the channel. However, if the coin continues with the bullish movement, the bulls could hit the resistance levels of $4.0, $4.2, and $4.4.
On the contrary, if the coin slide below the 9-day and 21-day moving averages, it could return the coin to the support levels of $1.5, $1.3, and $1.1 respectively. Meanwhile, the long-term buyers should not be bothered by the small impact on the road, as the future of DYDX is assured according to the technical indicator Relative Strength Index (14).
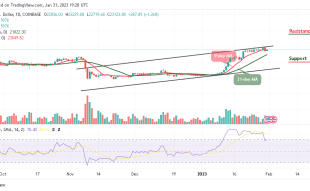
Against Bitcoin, the dYdX price is hovering above the 9-day and 21-day moving averages as the coin moves to cross above the channel. The technical indicator Relative Strength index (14) is also confirming the bullish movement with the signal line moving into the overbought region. Meanwhile, a possible fall may surface if the technical indicator turns and faces downward, and it may likely cross below the 9-day and 21-day moving averages to hit the support level of 780 SAT and below.
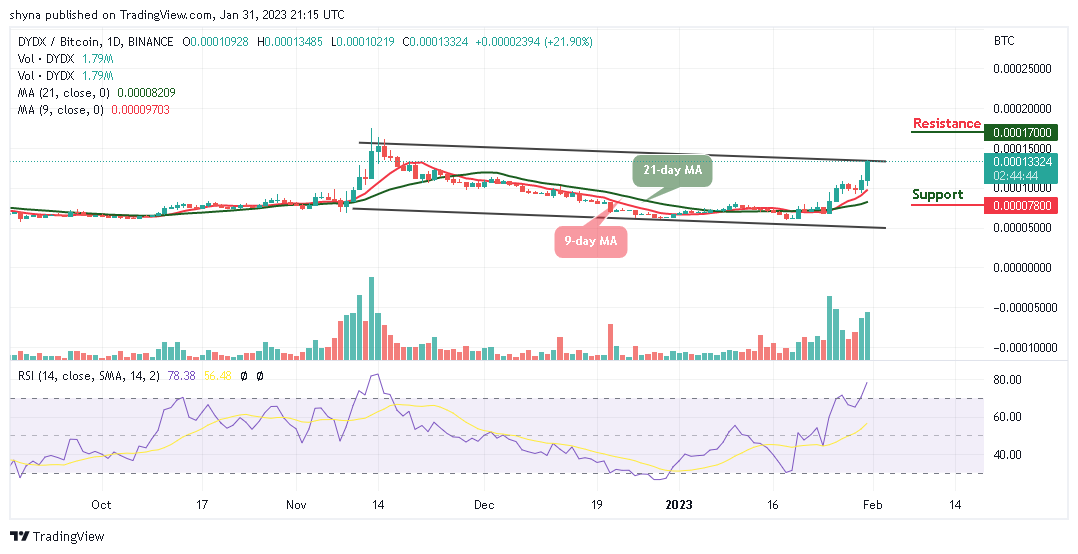
Nevertheless, any further bullish movement above the upper boundary of the channel could hit the resistance level of 1700 SAT and above as this could take the coin to a new high, and the market may remain in the bullish zone for a while.
dYdX Alternatives
The dYdX price is moving tremendously within the channel and it is likely for the coin to hit the important resistance level of $3.5 if the buyers increase the pressure. Meanwhile, the Meta Masters Guild (MEMAG) is another crypto that benefits traders in the market. This token is this year’s Play-to-Earn guild with the fastest growth. As a result, it will be Web3’s largest mobile gaming guild. It is possible to develop games that are entertaining and intriguing and work with NFTs. And there, community members receive rewards for their investments and speculation. There has already been close to $2.5 million raised during the MEMAG presale.
Join Our Telegram channel to stay up to date on breaking news coverage