Join Our Telegram channel to stay up to date on breaking news coverage
The Ethereum price prediction reveals that ETH is facing key support at $1,600 as the market price may gain more downs.
Ethereum Prediction Statistics Data:
- Ethereum price now – $1,710
- Ethereum market cap – $208.6 billion
- Ethereum circulating supply – 121.8 million
- Ethereum total supply – 121.8 million
- Ethereum Coinmarketcap ranking – #2
ETH/USD Market
Key Levels:
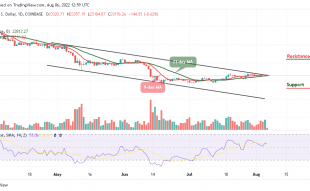
Resistance levels: $2500, $2700, $2900
Support levels: $1000, $800, $600
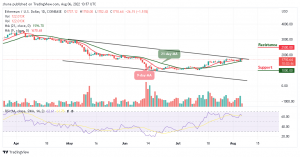
As the market opens today, after touching the resistance level of $1,750, ETH/USD begins to drop with a bearish bias. The coin opens at $1,737, and it is currently dropping towards the support level of $1,700. For the past few days, the Ethereum price has been moving sideways, trading around the 9-day and 21-day moving averages. The market price could correct higher, but it is likely to face more sellers below the moving averages.
Ethereum Price Prediction: Ethereum (ETH) May Head to the South
At the time of writing, the Ethereum price is ranging, and the coin is likely to break down heavily to gain more downtrends. However, ETH/USD is currently hovering at $1,710 as it prepares to cross below the moving averages. Should it spike below this barrier, the critical support levels of $1000, $800, and $600 may be tested as the technical indicator Relative Strength Index (14) moves to cross below the 60-level.
Meanwhile, ETH/USD could either recover above the channel or extend its decline towards the support level of $1500. On the upside, the next major resistance is near the $1900 level. But, the coin may hit the resistance levels of $2500, $2700, and $2900. If not, there is a risk of more downsides toward the lower boundary of the channel.
Against Bitcoin, the daily chart shows that the Ethereum price is hovering above the 9-day and 21-day moving averages. If the price crosses above the upper boundary of the channel, there is a possibility that the coin may head to the upside. The next resistance key above this level is close to the 8000 SAT. If the price rises, it could even break the 9000 SAT and above in future sessions.
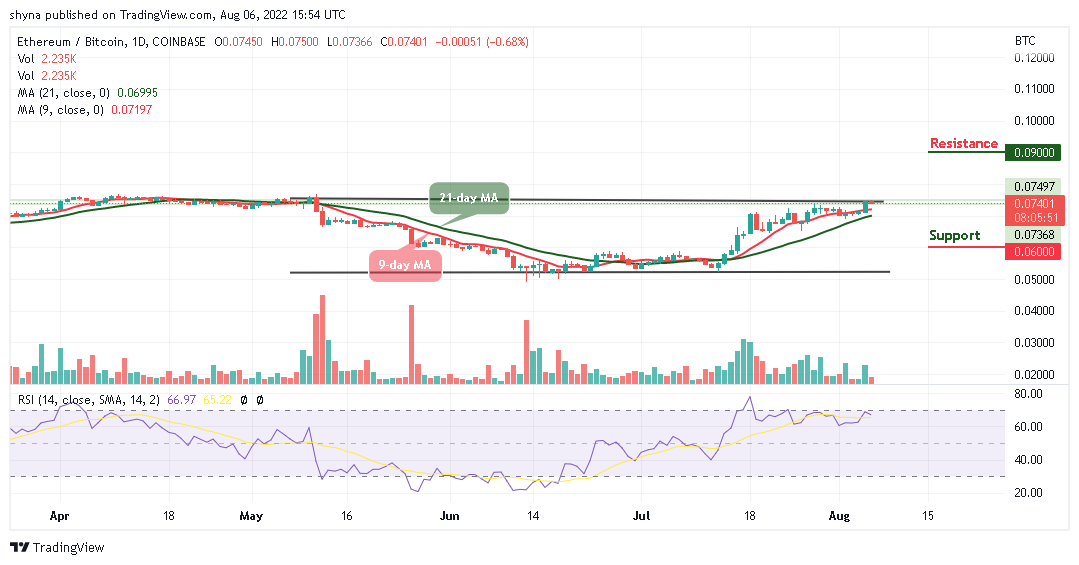
However, if the bears bring the price below the moving averages, 7000 SAT support may play out. Any further bearish movement could roll the coin to the critical support at 6000 SAT and below. The Relative Strength Index (14) remains below the 70-level, suggesting bearish signals.
Join Our Telegram channel to stay up to date on breaking news coverage