
Join Our Telegram channel to stay up to date on breaking news coverage
Over the past week, the price of Ethereum has been hovering between the levels of $1855 and $1700, creating a narrow range.
This consolidation phase was anticipated to revive bullish momentum, but due to the growing fear, uncertainty, and doubt (FUD) in the cryptocurrency market, the coin’s price has continued to move sideways. Despite the uncertain market conditions, traders interested in investing in Ethereum can still seek entry opportunities.
The combined resistance of the downsloping trendline of the symmetrical triangle pattern and the monthly barrier of $1700 was broken by a massive breakout during the Ethereum price recovery rally. This breakthrough provided buyers with a critical launchpad to extend the ongoing rally. However, after a rapid rally, it’s normal for asset prices to consolidate or pull back to verify stability at higher levels. As a result, the ETH price has been moving sideways since reaching the $1855 barrier.
ETH Market Price Analysis
At the time of writing, the price of Ethereum (ETH) has declined by 2.58%, trading at $1,717.92 with a trading volume of $9,996,057,345 in the last 24 hours. Over the past week, its value has decreased by 1.47%. Ethereum’s market capitalization is currently at $206,946,002,958, making it the second-largest cryptocurrency on CoinGecko, with 120 million ETH tokens in circulation.
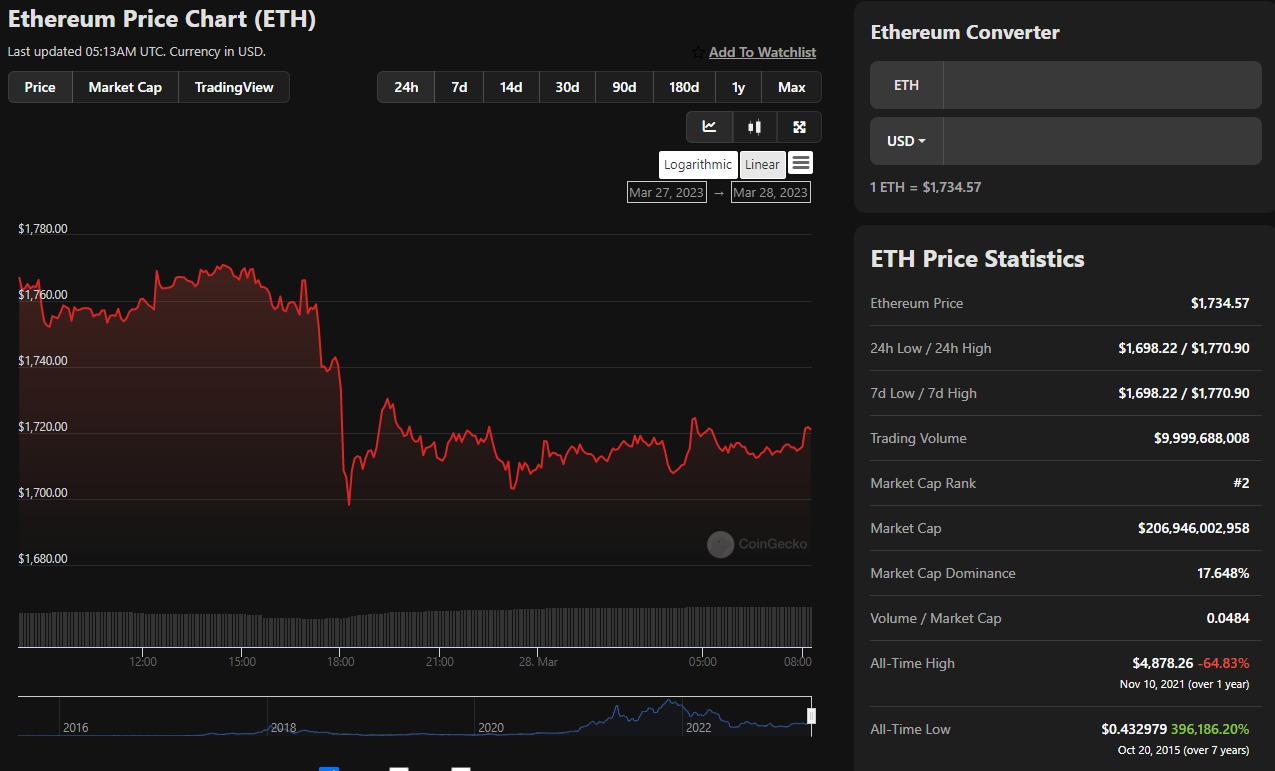
Recent market activity indicates a 16.90% increase in Ethereum’s trading volume in the past day. Although the highest price ever recorded for Ethereum was $4,878.26, over a year ago on November 10, 2021, the current price is 64.83% lower. However, the current value is significantly higher than the all-time low of $0.432979, recorded 7 years ago on October 20, 2015, with a staggering 396,186.20% increase from the lowest point.
Ethereum’s fully diluted valuation (FDV) is estimated at $206,944,200,797, representing the maximum market cap if all 120 million ETH tokens were circulated. In the last 7 days, Ethereum has outperformed the overall cryptocurrency market, with a price decrease of only 1.30% compared to the market’s decline of 4.60%.
Previous ETH Price Analysis
The previous analysis observed that the Ethereum price had undergone a significant rebound from the $1400 level, which served as the 200-day moving average. The price had surpassed the 50-day moving average of $1600 and had broken through the upper boundary of a symmetrical triangle pattern.
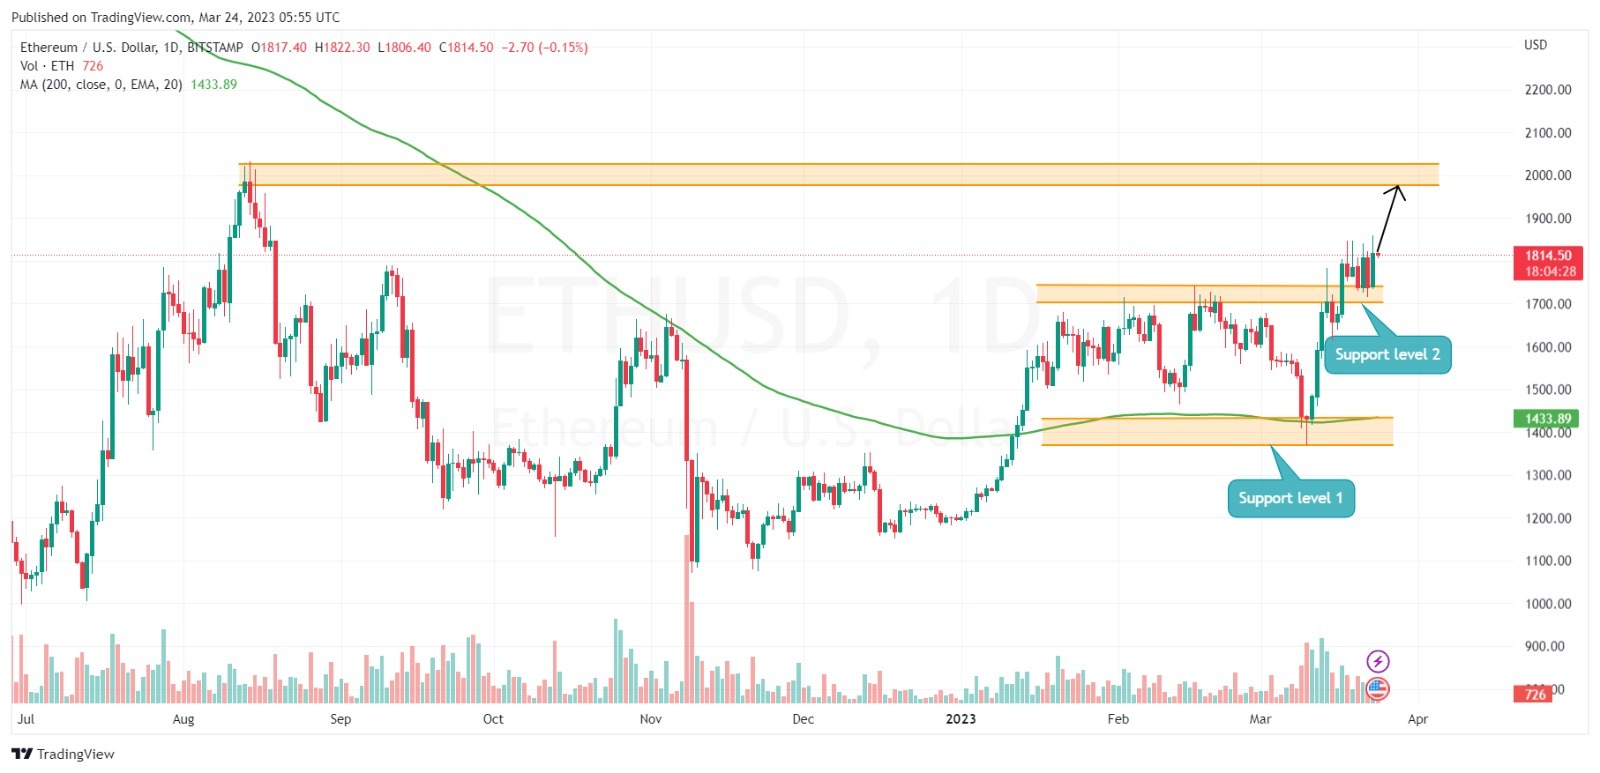
At that time, the price tested the crucial resistance level of $1800. If that breakout held, the price could have aimed for values above $2000, with a specific target of $2300 in the coming weeks. However, a correction towards either the 50-day or 200-day moving averages or the support area of $1300 could have been expected in the event of a false breakout.
The bullish trend was further supported by the relative strength index, which had a value of 61. Based on that analysis, the key levels to watch out for in ETH’s future price movements were $2054 and $2728.
ETH Price Prediction: ETH/USD Daily Chart Analysis
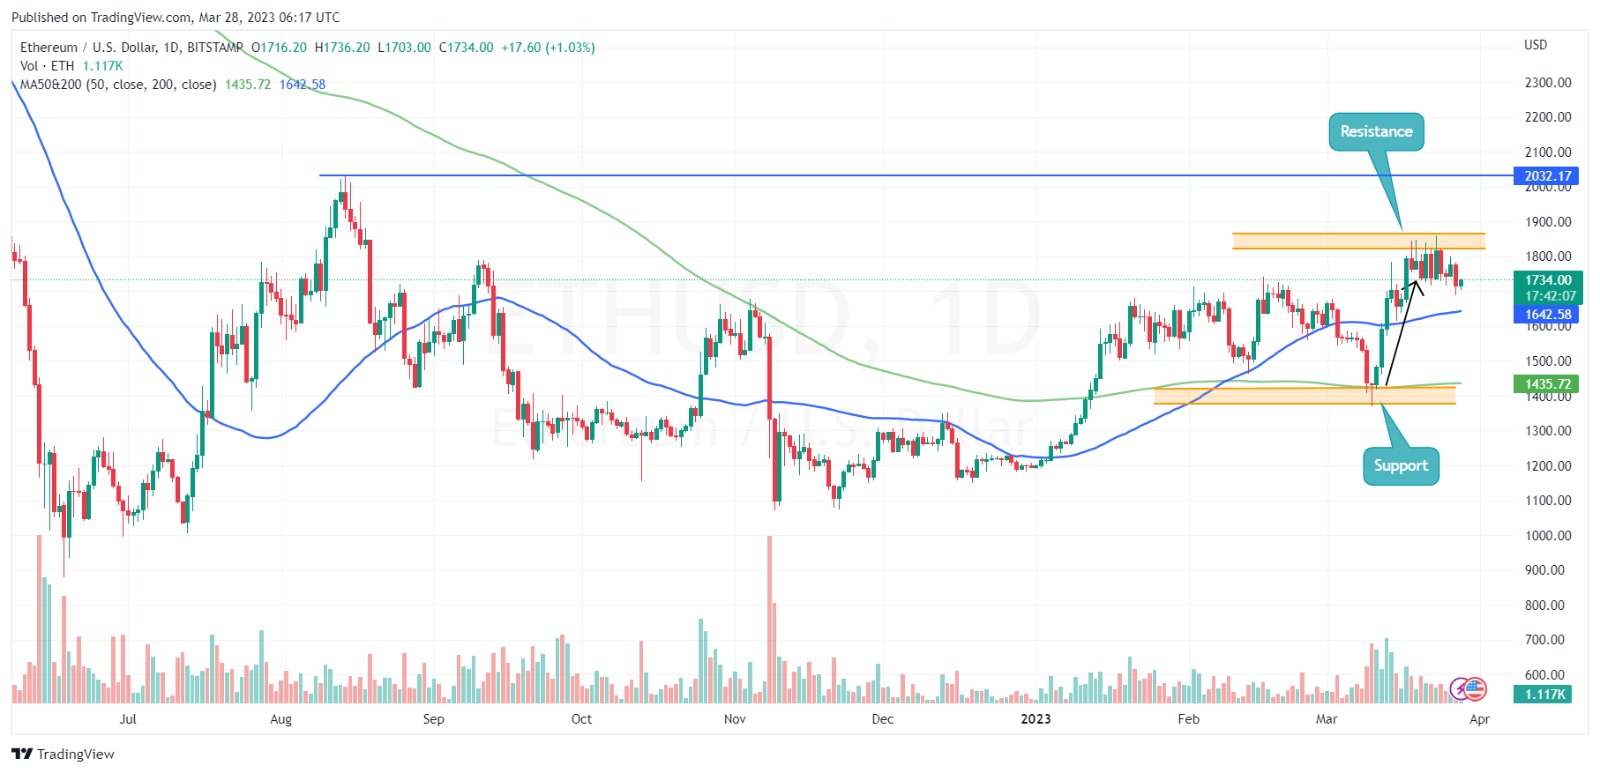
The price of ETH is adamant about breaking through the resistance level at $1855. This means the resistance level is more robust, having been tested several times. However, the price of ETH already respects psychological support at $1700. That shows that there is a high probability that the price of ETH might be surging soon.
Additionally, ETH is trading above the 50-day and 200-day moving averages, indicating a strong bullish move. Furthermore, the relative strength index (RSI) is bullish, trading above the 50-level mark. Based on the analysis above, if the price of ETH breaks above the resistance level, it might reach $2054. However, the price might retrace to the support level if the resistance zone becomes too strong.
Related
- Bitcoin Price Drops Back To $27,000 -Can We Expect A Surge This Week?
- MicroStrategy Repays $205M Silvergate Loan and Buys 6,500 More BTC
- Ethereum Price Prediction: ETH/USD Is Back Above $1400 Level
Best Wallet - Diversify Your Crypto Portfolio

- Easy to Use, Feature-Driven Crypto Wallet
- Get Early Access to Upcoming Token ICOs
- Multi-Chain, Multi-Wallet, Non-Custodial
- Now On App Store, Google Play
- Stake To Earn Native Token $BEST
- 250,000+ Monthly Active Users
Join Our Telegram channel to stay up to date on breaking news coverage