Join Our Telegram channel to stay up to date on breaking news coverage
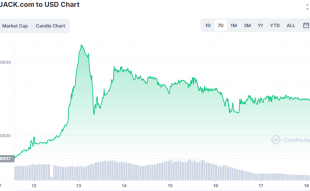
A period of market tug-of-war is what ended Balancer‘s bearish trend that started on the 11th of September to the 21st of September. The market deadlock continued from the 23rd till the 15th of October. Buyers began to have the upper hand from the 16th of October up till date. With the appearance of the 3 consecutive bullish candles on the chart, a new trend has started.
Balancer Market Price Statistic:
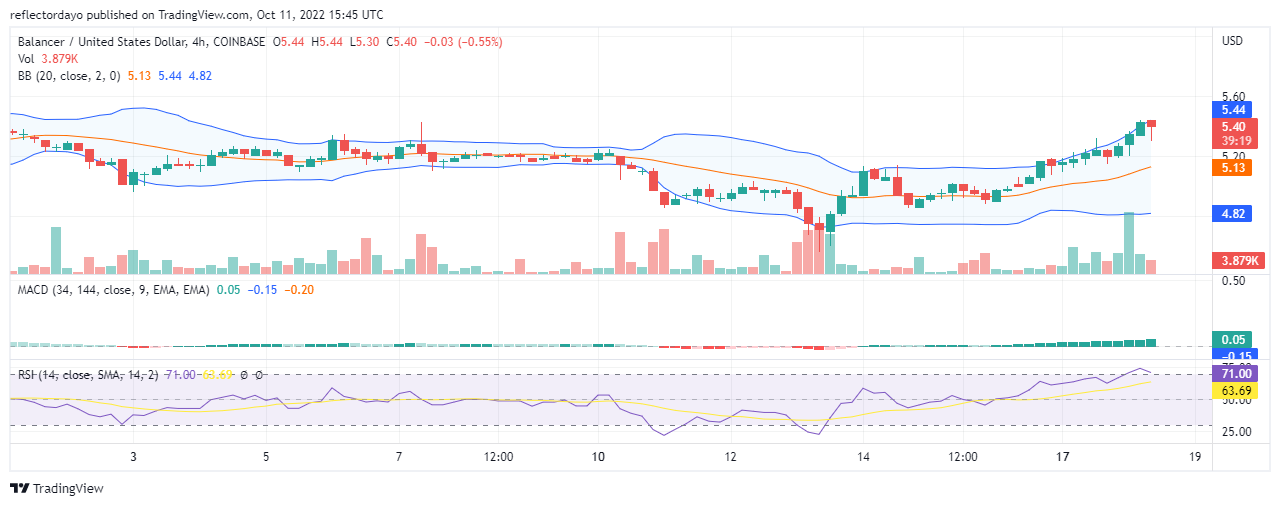
- BAL/USD price now: $5.44
- BAL/USD market cap: $236,754,718
- BAL/USD circulating supply: 43,822,909.75
- BAL/USD total supply: 52,125,147
- BAL/USD coin market ranking: #119
Key Levels
- Resistance: $6.00, $6.50 $7.00
- Support: $4.50 $4.00, $3.50
Balancer Market Price Analysis: The Indicators’ Point of View
Although the Balancer bullish trend was established with three consecutive candlesticks, the information from the Bollinger band has become a source of major concern. Despite the bullish move in the market for the past three days, the upper and lower band of the Bollinger remains unaffected by the market performance. This may be due to less amount of trading volume. When the difference between the proximity of the support and resistance is not much, the chance that the market will enter into a consolidation period again becomes high.
But, in the RSI indicator, the RSI line which was moving at the base of the bearish zone has now risen into the bullish zone measuring 53%. There is still room for more bullish performance.
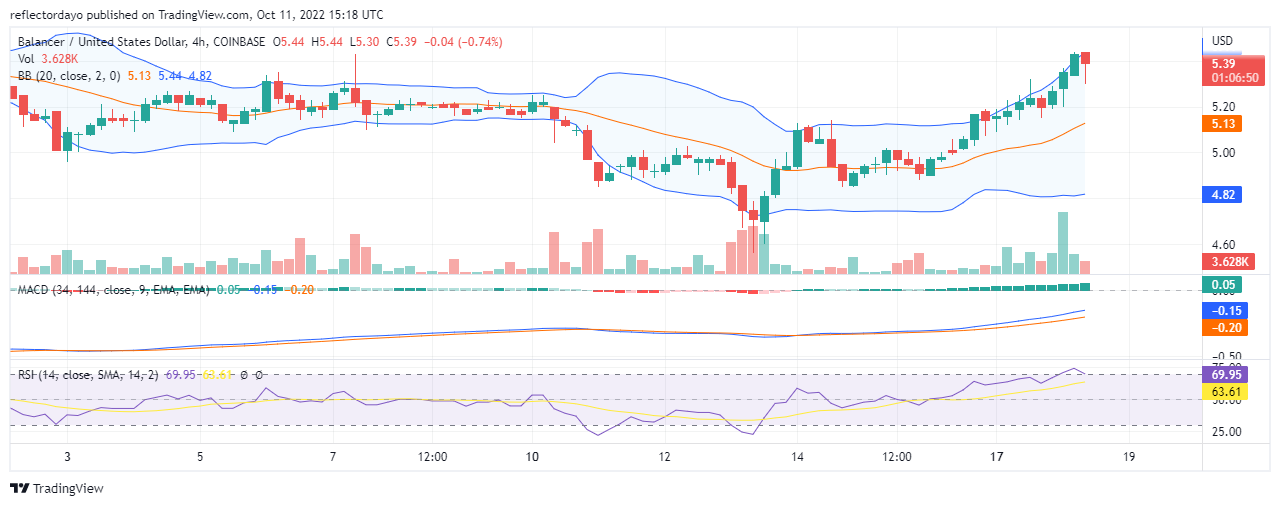
BAL/USD 4-Hour Chart Outlook
- The Bollinger band in this point of view is not like the one in the daily trading chart which we have examined above. When we look at the market performance in today’s trading activities, we can see that the upper band is now responding to the price movement as it is widening. In the third session, we noticed a price pullback and this was due to a recovery from the overbought. The trend is expected to continue steadily as it attains new higher price levels.
Related
Join Our Telegram channel to stay up to date on breaking news coverage