
Join Our Telegram channel to stay up to date on breaking news coverage
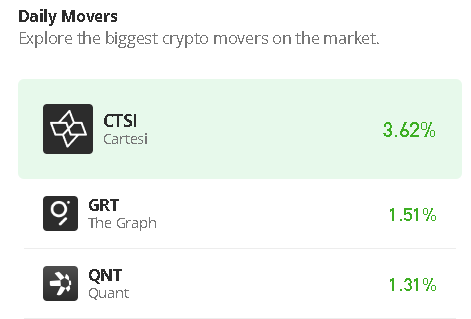
Over the past 24 hours, Cartesi price prediction shows that CTSI gains 3.14%, and the next resistance level could be at $1.145.
Cartesi Prediction Statistics Data:
- Cartesi price now – $1.129
- Cartesi market cap – $96 million
- Cartesi circulating supply – 737 million
- Cartesi total supply – 1 billion
- Cartesi Coinmarketcap ranking – #181
CTSI/USD Market
Key Levels:
Resistance levels: $1.250, $1.260, $1.270
Support levels: $0.030, $0.020, $0.010
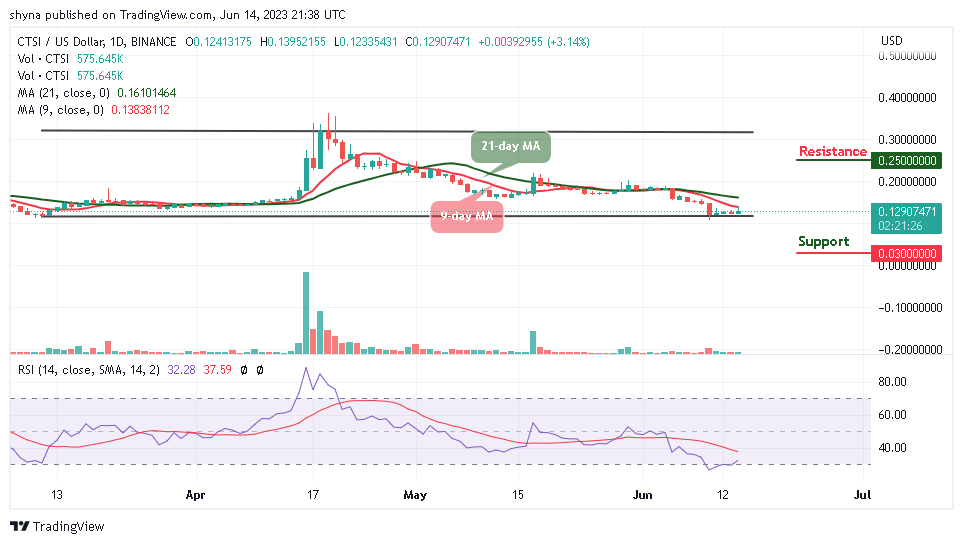
CTSI /USD is seen trading from the opening price at $0.124 to the cross above the 9-day moving average. However, while the coin is seen slightly retreating below the daily high of $1.139, the pair keeps following the sideways movement. Moreover, the Cartesi price is currently trading at $1.129 in a daily uptrend which could form a bear flag in the long term.
Cartesi Price Prediction: What is the Next Direction for CTSI?
Looking at the daily chart, the Cartesi price could face the north as it is getting ready to cross above the 21-day moving average. However, today’s low at $1.123 could serve as strong support for the coin, but if it is broken, the sell-off may be extended to $0.95. At the moment, the bulls are planning to retain the market by pushing the Cartesi price above the 9-day and 21-day moving averages.
However, if the price slides below the lower boundary of the channel, it could hit the support levels of $0.030, $0.020, and $0.010. As the daily chart reveals, the Relative Strength Index (14) is recovering from the oversold region, which indicates that the bullish trend may begin to play out. Meanwhile, if the bulls increase the buying pressure and push the Cartesi price higher, further resistance levels could be found at $1.250, $1.260, and $1.270.
Against Bitcoin, the Cartesi (CTSI) is demonstrating a positive sign, aiming to cross above the 9-day moving average. Nevertheless, the trend is ranging within the channel and it is currently changing hands at 516 SAT which is very close to the 9-day MA.
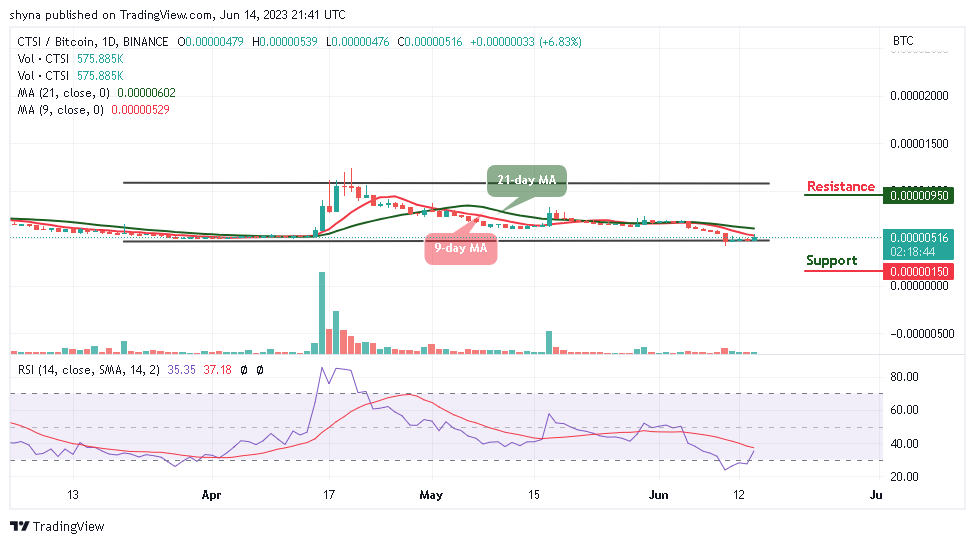
Moreover, if the coin cross above the 21-day moving average, the potential resistance level could be found at 950 SAT and above but crossing below the lower boundary of the channel may locate the closest support level at 150 SAT and below. Therefore, the technical indicator Relative Strength Index (14) is moving to cross above the 40-level, indicating more bullish signals.
Cartesi Alternatives
The Cartesi price is beginning to create a new bullish movement as the coin moves to cross above the 9-day moving average. However, if the coin successfully crosses above this barrier, it could create additional gains above the resistance level of $0.200. Meanwhile, predicting the long-term price of presale coins can be difficult, particularly for those as volatile as meme coins. However, Wall Street Memes has an established community and a team that has already proven itself in the crypto industry as almost $7m has been raised so far.
New OKX Listing - Wall Street Memes

- Established Community of Stocks & Crypto Traders
- Featured on Cointelegraph, CoinMarketCap, Yahoo Finance
- Rated Best Crypto to Buy Now In Meme Coin Sector
- Team Behind OpenSea NFT Collection - Wall St Bulls
- Tweets Replied to by Elon Musk
Join Our Telegram channel to stay up to date on breaking news coverage