Join Our Telegram channel to stay up to date on breaking news coverage
Bitcoin (BTC) Price Prediction – November 6
The bullish momentum behind Bitcoin (BTC) could be slowly fading, suggesting that a correction is underway before reaching for higher highs.
BTC/USD Long-term Trend: Bullish (Daily Chart)
Key levels:
Resistance Levels: $17,200, $17,400, $17,600
Support Levels: $14,000, $13,800, $13,600

The performance of BTC/USD has been very impressive in the past one month, following the significant positive rally which has been surging the king coin to a fresh level after a series of healthy retracement. For the past three weeks or so, the Bitcoin market has remained in an ascending broadening wedge, following a bullish scenario. After trading below the $10,000 level in September, the cryptocurrency broke out and begin to create a bullish movement, touching the daily high of $15,977 level at the time of writing.
Will BTC Break above $16,000 Resistance or Reverse?
Ahead of the bulls lie the nearest resistance at $16,000, where the coin may reach or surpasses but the trend could turn down after testing the above resistance. If the bullish momentum continues, the price may further fly to $17,200, $17,400, and $17,600 resistances. On the downside, the seller may encounter support at $14,000, $13,800, and $13,600. The 24-hours positive move is been revealed on the daily chart as the RSI (14) keeps moving within the overbought zone. Meanwhile, if the market price drops, definitely the technical indicator may turn bearish.
BTC/USD Medium – Term Trend: Bullish (4H Chart)
On the 4-hour chart, BTC/USD is well and truly in the overbought region but that doesn’t seem to be impacting the momentum much, which implies hype and greed may be fuelling this rise as opposed to technical factor. Because of this, it’s possible that prices may fall as sharply as they have risen if the coin shows any weakness at the $16,000 resistance level.
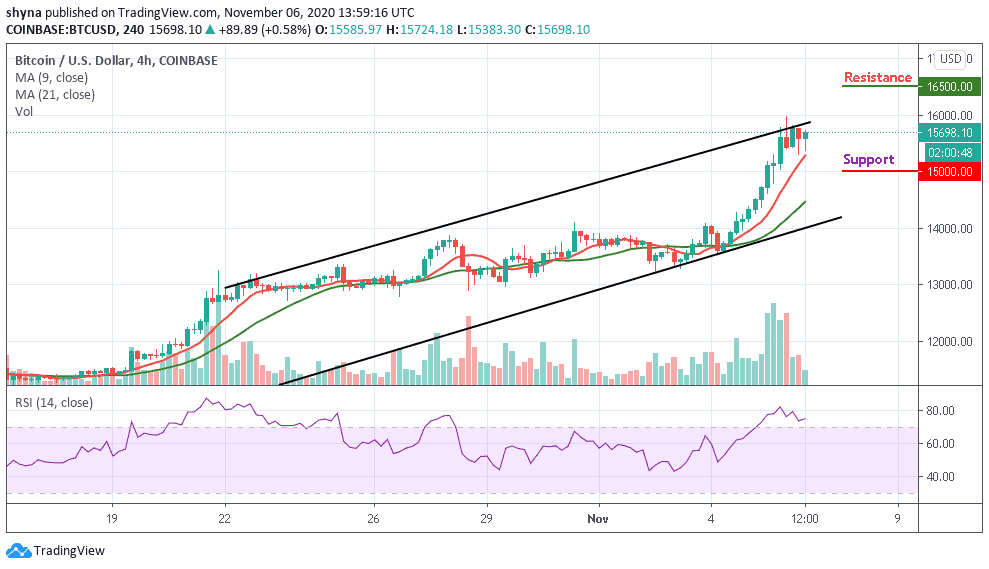
According to the RSI (14) indicator, traders may experience a trend reversal as the Bitcoin (BTC) may break below the 9-day moving average and start printing consecutive higher lows. More so, BTC/USD is currently in the middle of a consolidation, preparing for the next move. Breaking above the channel may push it to the potential resistance levels at $16,500 and above while the supports are located at $15,000 and below.
Join Our Telegram channel to stay up to date on breaking news coverage