Join Our Telegram channel to stay up to date on breaking news coverage
XRP Price Prediction – November 6
The bulls aim the next resistance at $0.260. If they fail, sellers’ rejection at $0.255 might take XRP to retest $0.245 support.
XRP/USD Market
Key Levels:
Resistance levels: $0.270, $0.280, $0.290
Support levels: $0.230, $0.220, $0.210
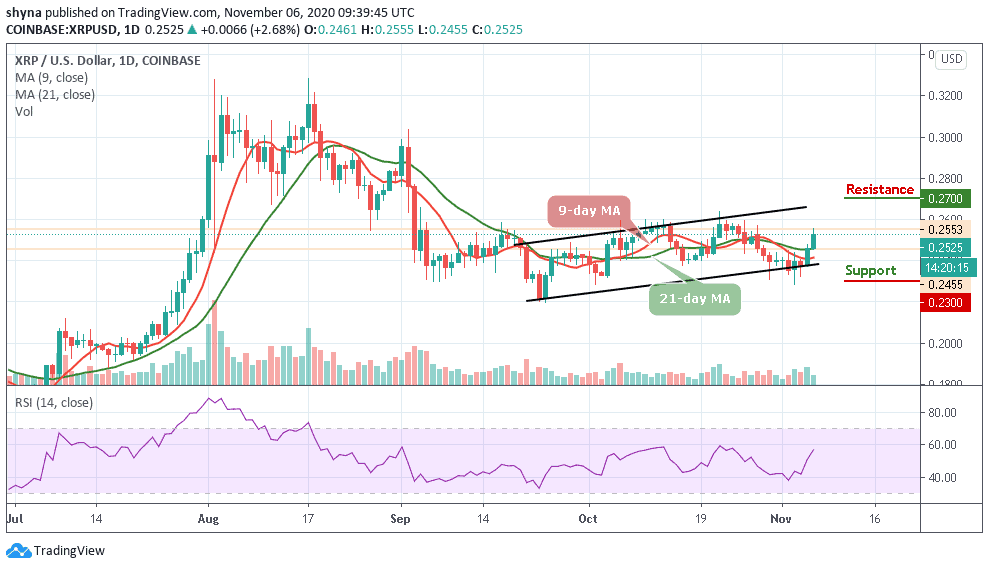
XRP/USD manages to reach a high of around $0.255 as the market opens today. A few weeks ago, Ripple was seen trading at the downside of the channel before starting the upward movement a couple of days ago. Meanwhile, the bullish trend today allows XRP/USD to climb back above $0.250. This bounce above the 9-day and 21-day moving averages shows that the buyers are still battling to be in control of the market momentum moving forward.
What to Expect from Ripple (XRP)
If the XRP bulls want to see a shift in momentum, they will need to keep the price above the moving averages, convert both the 9-day and 21-day moving averages into support levels and continue trading upwards until they create a bull cross above the upper boundary of the channel. A bullish breakout above $0.260 could take XRP up to the potential resistance levels of $0.270, $0.280, and $0.290 as the RSI (14) moves to cross above the 60-level.
At the moment, XRP/USD is trading at $0.252 after holding above $0.250. On the other hand, a drop beneath the moving averages may cause the Ripple price to spiral downward and head beneath the $0.250 level. Meanwhile, the local support may be created on approach to $240. If it is broken, the sell-off may be extended to critical supports at $0.230, $0.220, and to psychological $0.210 respectively.
Against Bitcoin, for the past three months, Ripple (XRP) has been falling drastically and now trading below the moving averages as the bulls failed to step back into the market. if the sellers continue to push the price down, the next support level may be located at 1500 SAT and further support may be found at 1400 SAT and 1300 SAT respectively.
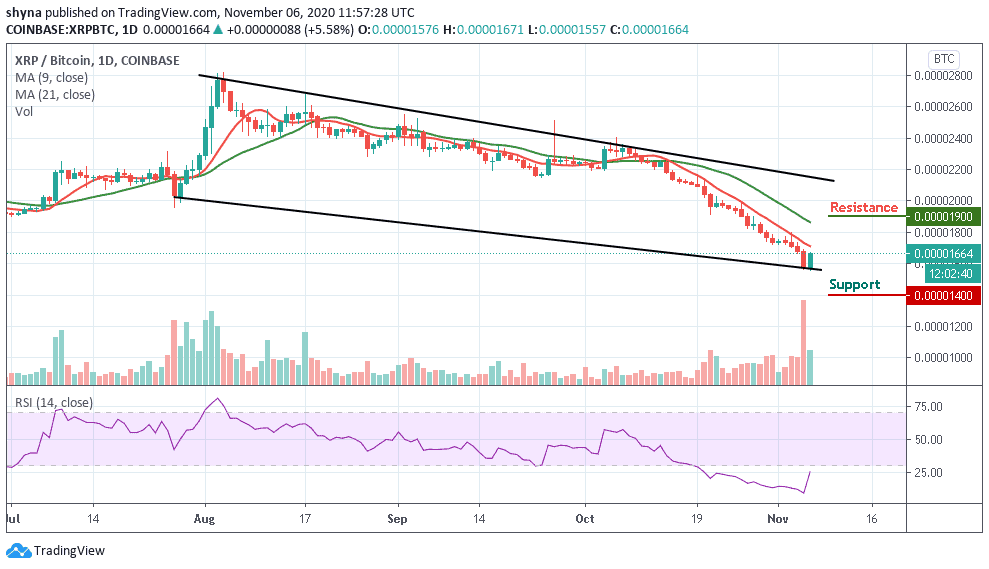
However, If the bulls put all the resources together and push the price above the moving averages, traders may expect the price-rise to 1900 SAT and 2000 SAT resistance levels. Meanwhile, the RSI (14) faces the north to move out of the oversold region, indicating an upward movement.
Join Our Telegram channel to stay up to date on breaking news coverage