
Join Our Telegram channel to stay up to date on breaking news coverage
The Binance Coin price prediction shows that BNB is facing $260 support to gain momentum to overcome the resistance level of $300.
Binance Coin Prediction Statistics Data:
- Binance Coin price now – $272.7
- Binance Coin market cap – $43.9 billion
- Binance Coin circulating supply – 161.3 million
- Binance Coin total supply – 161.3 million
- Binance Coin Coinmarketcap ranking – #5
BNB/USD Market
Key Levels:
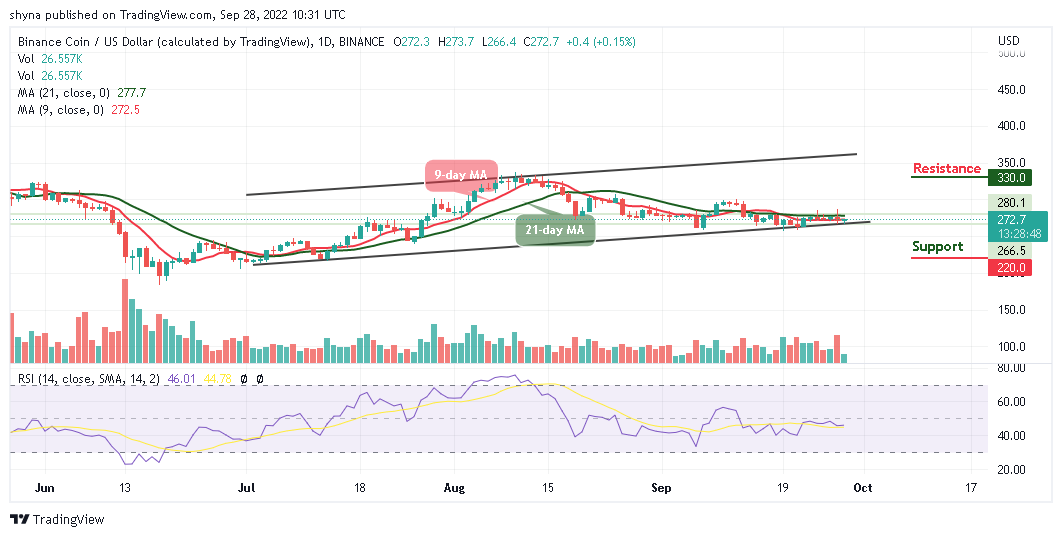
Resistance levels: $330, $350, $370
Support levels: $220, $200, $180
Your capital is at risk
BNB/USD is moving sideways as the coin trades around the 9-day moving average. During the European session today, the Binance Coin touches the resistance level of $273 with the generally bullish market, but at the time of writing, the coin is hovering at $272.7.
Would BNB Price Move to the Upside?
The Binance Coin price is trading at $272.7 aiming to cross below the lower boundary of the channel in the daily chart. At the time of writing, the drop is likely to be slight as the technical indicator Relative Strength Index (14) stays below the 50-level. The nearest support at $250 is likely to hold despite the slight arm of the bears, while sideways trading could also take precedence based on the technical indicator.
However, for the coin to come out of the resistance range under $300, BNB/USD must pull toward $280 and focus on taking down higher resistance levels at $330, $350, and $370. Nevertheless, if the bullish failed to push the coin to the upside and $250 support comes to focus, expect more support at $230 below the lower boundary of the channel, and any further support levels could be located at $220, $200, and $180
Against Bitcoin, the Binance Coin is currently above the 9-day and 21-day moving averages. On the contrary, if the coin slides below the 21-day moving average, the 1300 SAT and below could provide a support level for the next selling pressure, but the Relative Strength Index (14) is moving towards the 60-level.
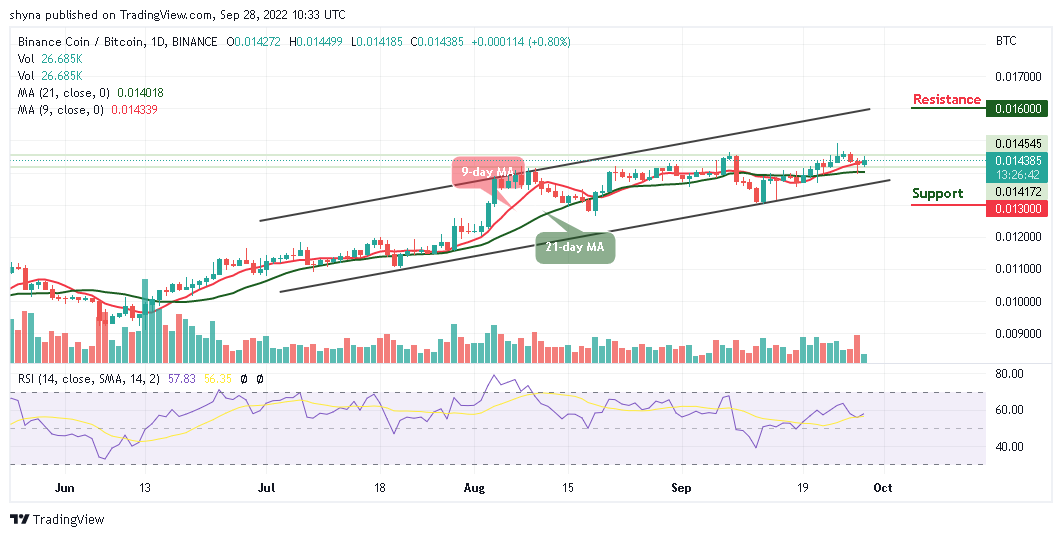
Meanwhile, after touching the daily high of 1449 SAT today, BNB/BTC price drops to where it is currently trading at 1438 SAT. However, if the support level of 1418 SAT can act as a solid line of defense against any further downtrend; the resistance level of 1600 SAT and above may come into focus.
Join Our Telegram channel to stay up to date on breaking news coverage