Join Our Telegram channel to stay up to date on breaking news coverage
The Bitcoin price prediction reveals that BTC retreats sharply after retesting the $19,234 level, and the king coin could dive to a new monthly low.
Bitcoin Prediction Statistics Data:
- Bitcoin price now – $18,610
- Bitcoin market cap – $357.4 billion
- Bitcoin circulating supply – 19.1 million
- Bitcoin total supply – 19.1 million
- Bitcoin Coinmarketcap ranking – #1
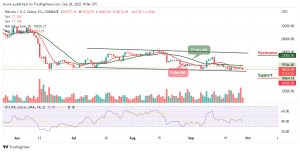
BTC/USD Long-term Trend: Ranging (Daily Chart)
Key levels:
Resistance Levels: $23,000, $25,000, $27,000
Support Levels: $16,000, $14,000, $12,000
Your capital is at risk
BTC/USD is trading around $18,610 within the 9-day and 21-day moving averages. Looking at the daily chart, Bitcoin (BTC) is likely to follow a bearish zone, and it could slide below the lower boundary of the channel to touch the nearest support at $17,000.
Bitcoin Price Prediction: Would Bitcoin (BTC) Break More Downs?
The Bitcoin price is currently changing hands at $18,610, however, where BTC trends next may partly depend on whether or not buyers can close today’s candle above the $19,000 level. Should in case this comes to play, the bulls may propel prices higher, and then traders may expect the king coin to rise above the $22,000 resistance, which could later move towards the potential resistance levels at $23,000, $25,000, and $27,000.
On the other hand, if the Bitcoin price failed to close above the $19,000 level; the price could drop below the lower boundary of the channel. A low drive could send the price to $16,000, $14,000, and $12,000 supports. Meanwhile, the technical indicator Relative Strength Index (14) has recently revealed a sign of trend reversal as the signal line shows a possible bearish momentum within the chart.
BTC/USD Medium-term Trend: Ranging (4H Chart)
Looking at the 4-hour chart, BTC/USD is trading below the 9-day and 21-day moving averages. Looking at it from above, if the Bitcoin price could cross above the moving averages, then the next level of resistance could be $19,500 along with the significantly mentioned ascending trend-line. The next resistance could be $20,000 and above.
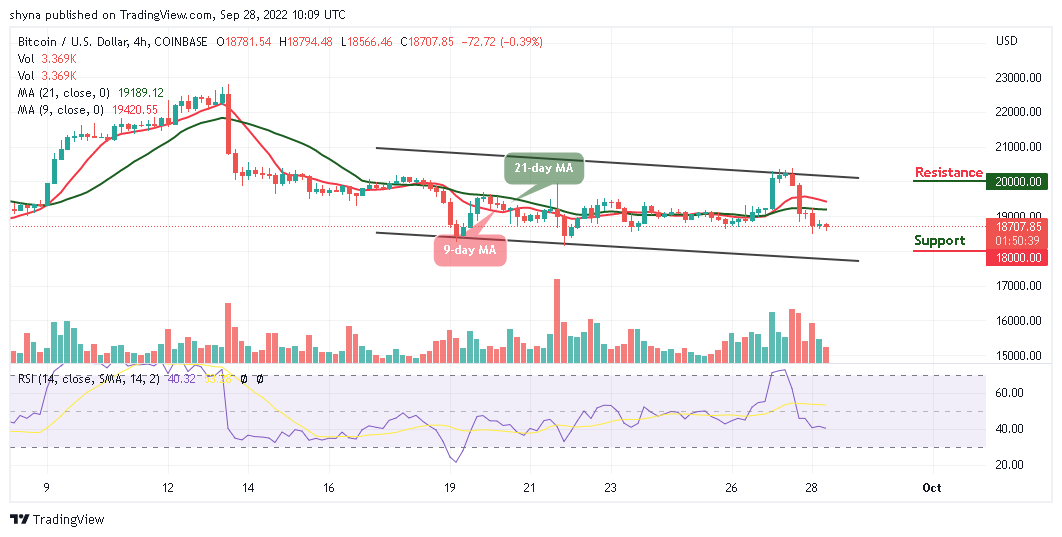
Meanwhile, as the technical indicator ranges, this might have signaled a temporary end to the bullish trend of Bitcoin for a moment. However, if the coin falls toward the lower boundary of the channel, the market price may likely reach the support levels of $18,000 and below.
Join Our Telegram channel to stay up to date on breaking news coverage