
Join Our Telegram channel to stay up to date on breaking news coverage
BCH May Recover– September 24
The situation now portends that the crypto economy may recover from a point closely above the $100 support baseline as some leftover declining forces are yet to play out in the BCH/USD market activities for quite a while. The price is around $120.38 at a minimal positive percentage rate of 0.16.
BCH Price Statistics:
BCH price now – $120.38
BCH market cap – $2.3 billion
BCH circulating supply – 19.2 million
BCH total supply – 19.2 million
Coinmarketcap ranking – #30
BCH May Recover: BCH Market
Key Levels:
Resistance levels: $140, $150, $1600
Support levels: $100, $90, $80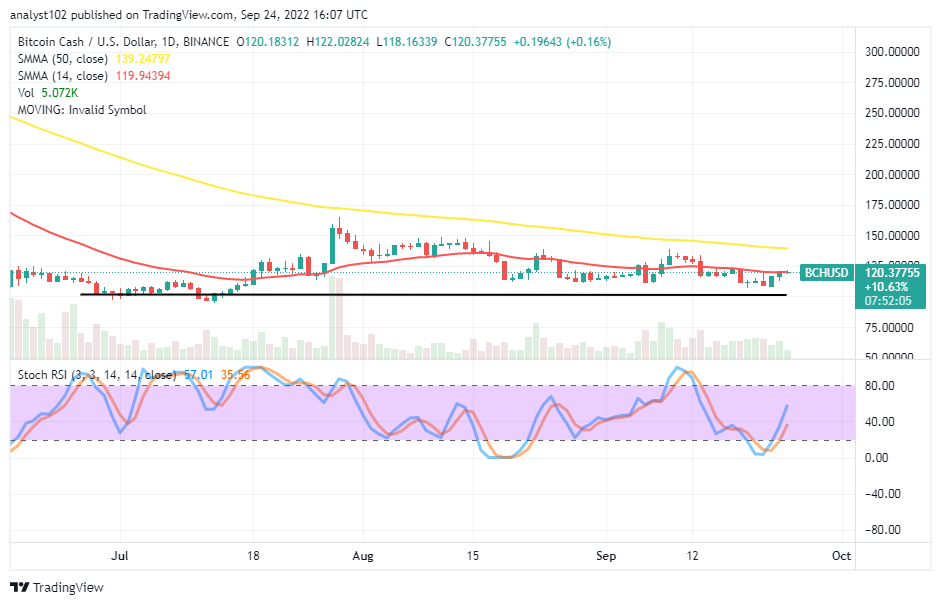 BCH/USD – Daily Chart
The BCH/USD daily chart showcases the crypto market may recover around the trend line of the smaller SMA. Noticeably, the positioning of the SMAs suggests that the trade trend is in a range-bound format. The 14-day SMA trading indicator is at the $119.94 value-line, underneath the $139.25 point of the 50-day SMA indicator. The horizontal line is at the $100 support level serving as the critical baseline trading zone against any aggressively declining motion that can occur afterward in the market.
Your capital is at risk.
Has the bullish momentum been completed in the BCH/USD market operations for now?
From the technical reading outlook of the Stochastic Oscillators, the BCH/USD trade appears not to have completed its bullish momentum gathering by now, as it has been that the crypto market may recover from a lower-trading spot. Bulls pushing capacity force is gradually getting exhausted underneath the sell signal of the 50-day SMA’s resistance trading value. Based on that assumption, long-position placers may ride along an active motion from the smaller SMA trend line to a higher point. But, they need to be cautious of any reversal move in the process.
On the downside of the technical analysis, the crypto business may potentially encounter resistance around the points of either $135 or $140 if the price lacks explosion to spike northward further through the variant higher resistance value lines. A pull-up coupling with rejection will signify a good sell entry for the BCH/USD market bears. Traders have to be using either a 1-hour or 4-hour chart to determine when to execute an order.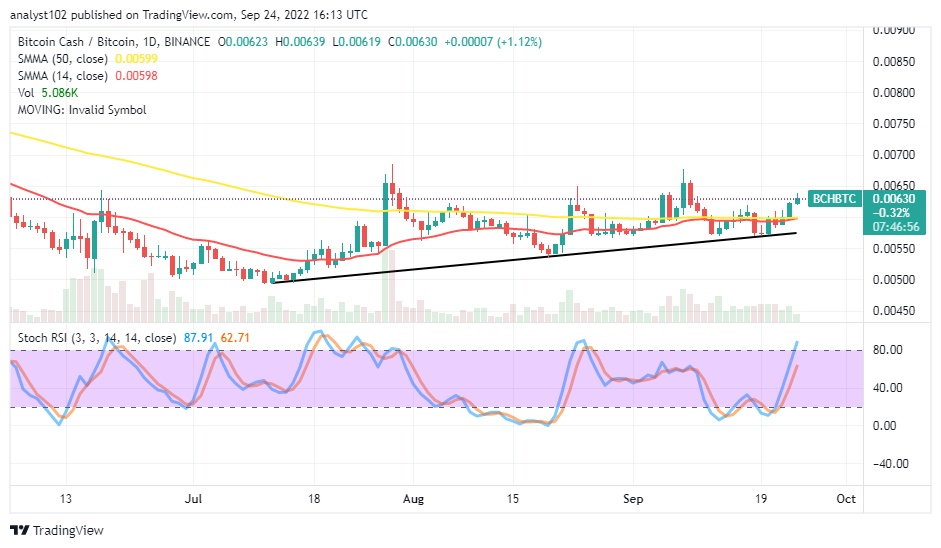
BCH/BTC Price Analysis
In comparison, Bitcoin Cash has relatively built on a bullish threshold path against Bitcoin. The crypto-pairing-coin market may recover, setting a target to achieve a higher point above the trend lines of the SMAs. The 14-day SMA indicator has moved up tightly to join the 50-day SMA indicator from beneath. The Stochastic Oscillators have crossed northbound to reach 62.71 and 87.91 range values. That calls for caution against seeing the base crypto pushing stronger with its counter crypto in the subsequent operations.
Read more:
- How to buy Bitcoin-cash
- How to buy cryptocurrency
- Bitcoin Cash Price Prediction: BCH/USD Price Ranges as the Coin Holds $224 Key Support
Join Our Telegram channel to stay up to date on breaking news coverage