Join Our Telegram channel to stay up to date on breaking news coverage
BCH Goes Northward – August 24
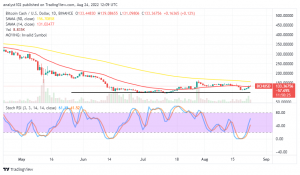
A change has occurred in the downward-trending motions recently in the BCH/USD market operation as the crypto’s price goes northward. In the last seven days of trading activities, the crypto has been between $112.32 and $138.12, representing low and high-value points.
BCH Price Statistics:
BCH price now – $133.64
BCH market cap – $2.6 billion
BCH circulating supply – 19.1 million
BCH total supply – 19.1 million
Coinmarketcap ranking – #29
BCH Goes Northward: BCH Market
Key Levels:
Resistance levels: $160, $180, $200
Support levels: $110, $100, $90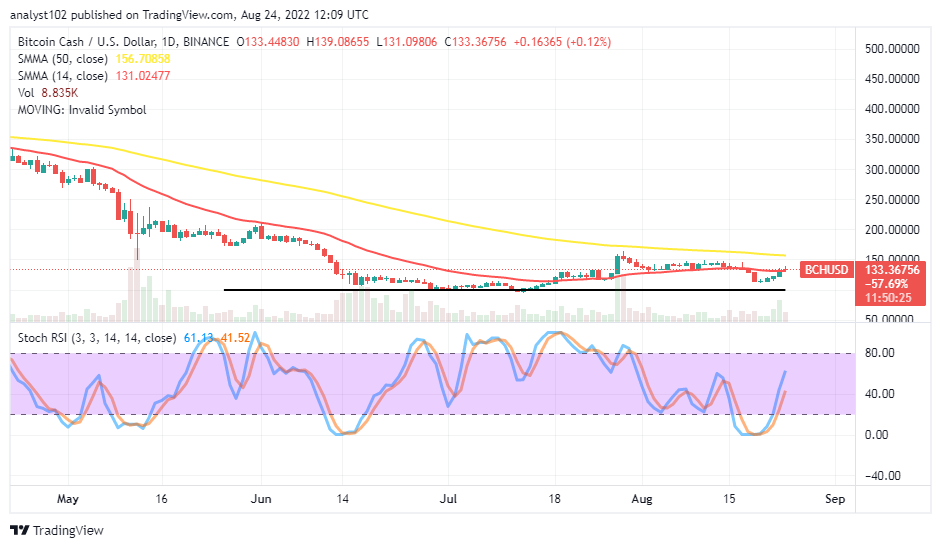 BCH/USD – Daily Chart
The daily chart reveals the BCH/USD market activity goes northward above the trend line of the smaller SMA. The 50-day SMA indicator is at $156.70858 above the $131.02477 point of the 14-day SMA indicator. The critical support baseline drew at the $100 level. The Stochastic Oscillators have crossed northbound from the oversold region, reaching 41.52 and 61.13 range points. And they are still pointing toward the north side. That signifies an upward pressure may still play out.
Your capital is at risk.
Is there any indication supporting a surge to the $160 resistance in the BCH/USD market, is certain?
There is the probability that the BCH/USD market will push upward to around $150 or an extension of the $160 resistance level as the crypto’s price goes northward, eyeing the previous higher point. A continual healthy push to the upside from the trend line of the 14-day SMA will potentially allow the market line to reach some other imaginable resistances following to a top zone. Contrarily to those assumptions, buyers’ strength appears not to have sustainable ups even though a bounce-off occurs at this point.
On the downside of the technical analysis, the BCH/USD market sellers have to re-energize between the smaller space of the 14-day SMA and the 50-day SMA to make a come-back in a significant downward-trending manner. In the meantime, the scenario may not be forthcoming in the near time. Therefore, shorting activities may have to suspend until the price forms another pattern coupling with several rejections around the trend lines of the trading SMAs before considering a sell order.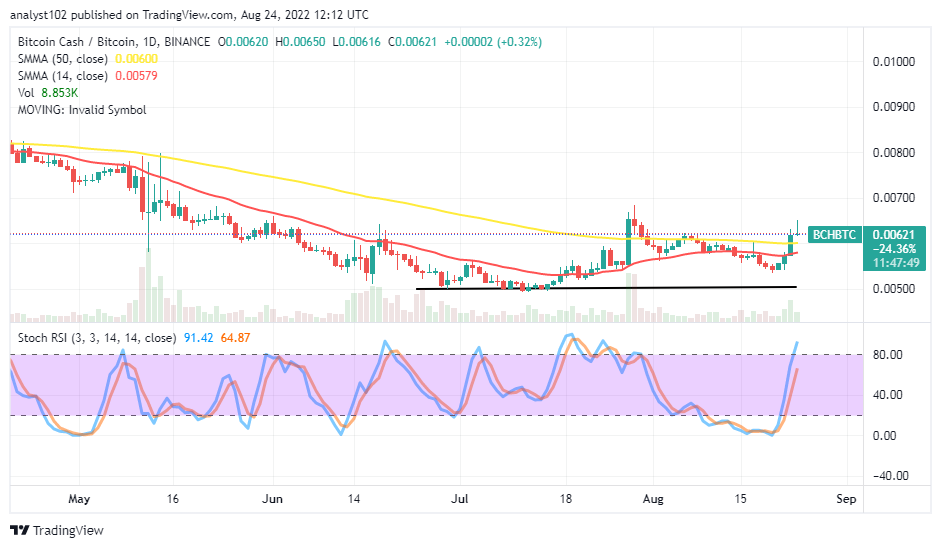
BCH/BTC Price Analysis
Bitcoin Cash, in comparison with the trending catalyst of Bitcoin, has regained momentum to push higher. In other words, the cryptocurrency pair market goes northward, slightly breaking past the SMA trend lines to the upside. The 14-day SMA indicator is underneath the 50-day SMA indicator. The Stochastic Oscillators have crossed northbound from the oversold region to reach 64.87 and 91.42 range values. The trading candlestick showing the present trading situation signals a reversal motion is in place. Therefore, the base crypto may soon lose positions to its counter crypto if such an outlook holds firmly.
Read more:
- How to buy Bitcoin-cash
- How to buy cryptocurrency
Join Our Telegram channel to stay up to date on breaking news coverage