Join Our Telegram channel to stay up to date on breaking news coverage
Bitcoin Cash (BCH) Price Prediction – August 12, 2020
BCH/USD rebounds above $280 after yesterday’s surprising breakdown. There was a general breakdown across the crypto currency markets. The bears sank the BCH below the $280 support which was intended to fall to the previous low at $245 low.
BCH/USD Market
Key Levels:
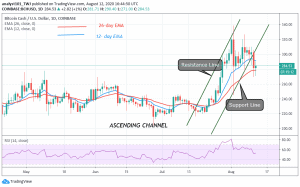
Resistance Levels: $280, $320, $340
Support Levels: $200, $160, $120
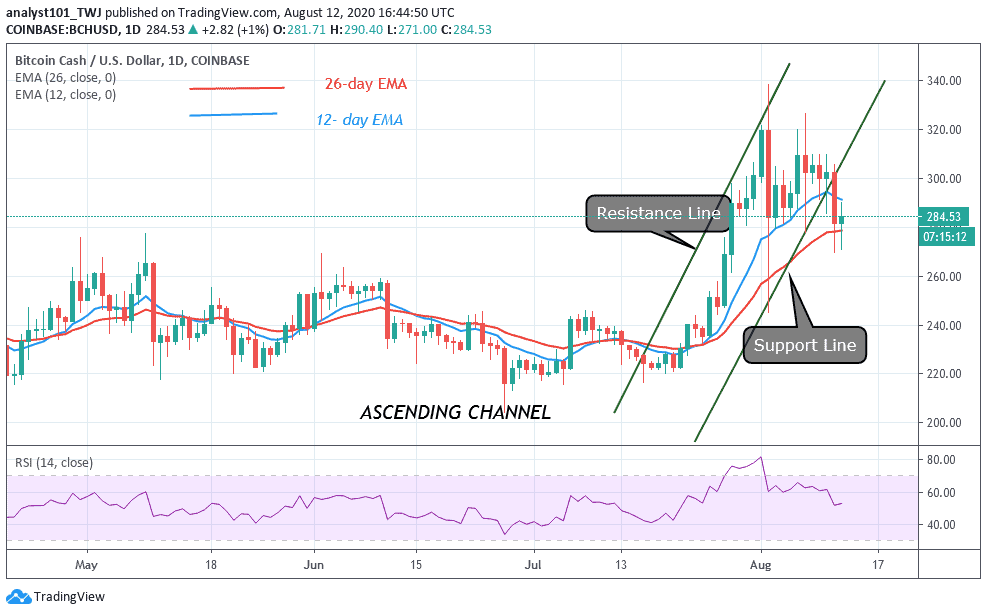
The recent breakdown below the critical $280 support was brief as bulls pushed BCH from its low of $270 to $280 before rebounding. BCH would have fallen to $245 low and later $220 low if the bears are successful. BCH bulls buy the dips to push the altcoin on the upside. Buyers have two major hurdles to jump over before attaining the $400 price levels. On the upside, if buyers break the $300 resistance and rebound above it, the $320 and $340 resistances would be breached. The momentum will extend to $400 high. However, if buyers fail to push above these resistances, prices will continue to fluctuate between $280 and $320. The crypto is at level 52 of the Relative Strength Index period 14. It indicates that BCH is in the bullish trend zone and will rise.
10 Bitcoin Cash Whales Drop, Following 39% Price Surge
Since August 1, Bitcoin Cash surged to over $311. This resulted in 10 Bitcoin Cash whales leaving the network possibly for trading or selling their millions in holdings. According to a crypto Twitter user, Ali Martinez, investors holding between 10,000-100,000 BCH estimated to be from $3 to $30 million has fallen since August 1. The drop was as a result of BCH rising from $224.46 on July 17 to $311.32 on July 31.
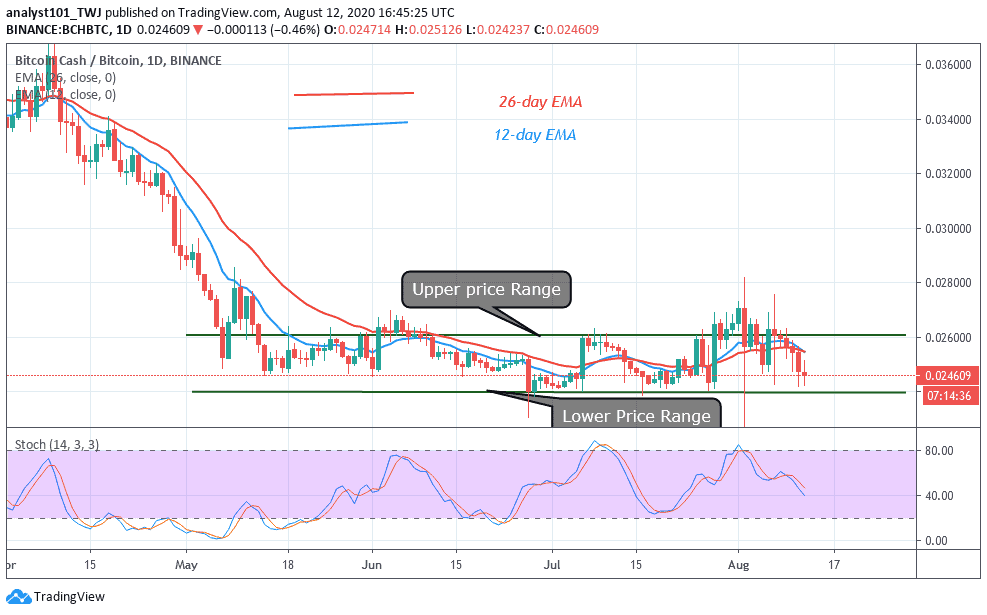
In the BCH/BTC chart, buyers and sellers are tussling for price possession in a confined range. Neither the bulls nor bears have the upper hand. The market is fluctuating between levels Ƀ0.024000 and $0.026000. On August 1, buyers pushed price to Ƀ0.028000 but were immediately repelled. The bears pushed price into the range as the market consolidation continues. In the meantime, the BCH/BTC pair is below 60% range of the daily stochastic. The market is in a bearish momentum.
Join Our Telegram channel to stay up to date on breaking news coverage