Join Our Telegram channel to stay up to date on breaking news coverage
BCH Price Prediction – July 26
The price of Bitcoin Cash may continue the downward momentum as revealed by the technical indicator RSI (14).
BCH/USD Market
Key Levels:
Resistance levels: $265, $275, $285
Support levels: $235, $225, $215

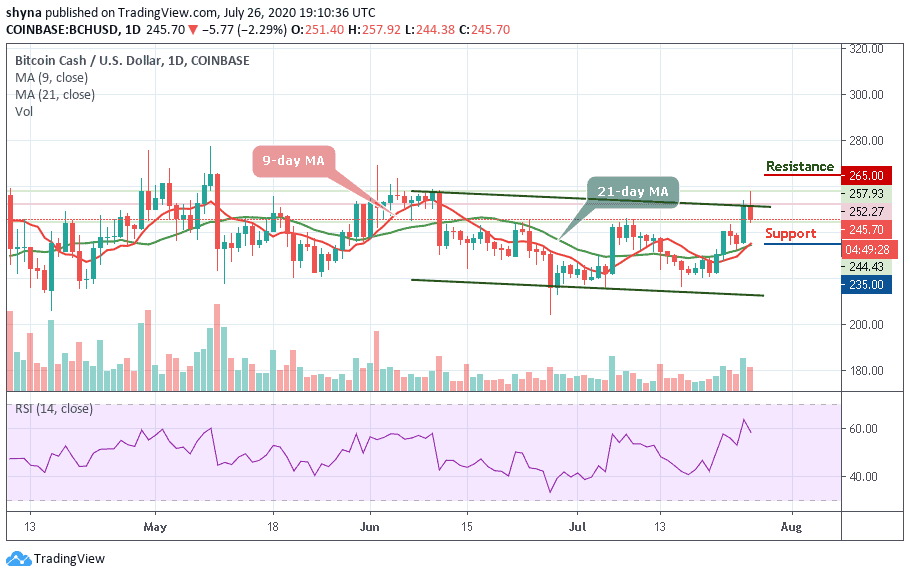
BCH/USD peaked at $257.93 but later turns down by following a downward trend within the channel. Meanwhile, for the price not staying above $260 ruins the long-term technical picture of the coin. Bitcoin cash will have to hold this ground to guide against the further downward pressure and the closest support expects the coin at $240. Once it is established, the downside may likely grow, with the next goal supporting $235, $225, and $215 levels.
However, the Bitcoin cash is hovering at $252.27 and trading above the 9-day and 21-day moving averages. On the upside, a sustained move above the upper boundary of the channel may ease the initial downside pressure and create momentum for the bulls with the focus to move the market to the next resistance levels of $265, $275, and $285 respectively.
At the moment, the technical indicator RSI (14) is moving below 60-level, which indicates that the downward momentum may continue to play out.
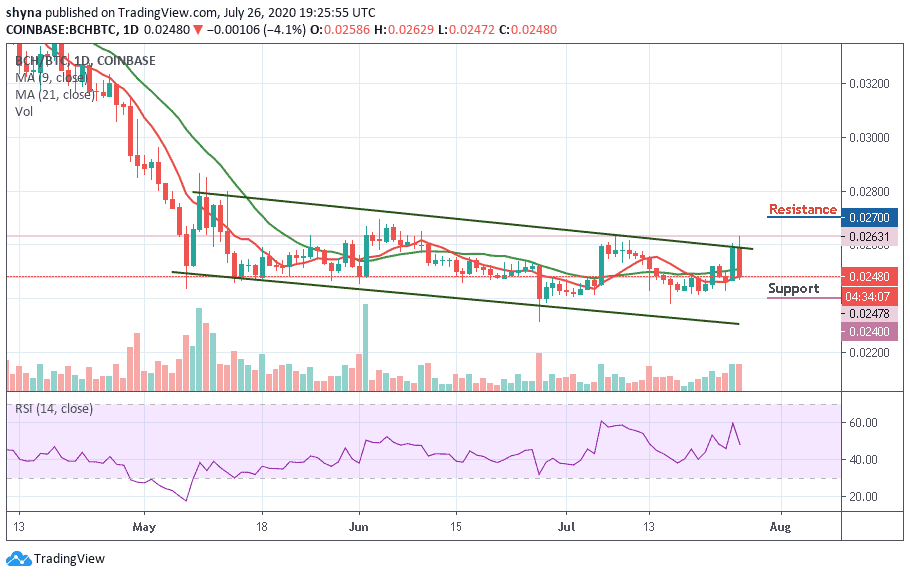
While comparing it with BTC, we can observe that the traders are yet to show a strong commitment to buying in the market. Meanwhile, if the bulls can turn strong now, traders may expect the market to roll to the 0.027 BTC and 0.028 BTC resistance levels.

However, the 0.024 BTC and 0.023 BTC levels may likely produce support for the market should in case the buyers failed to push the price to the north. Whichever way, the pair may continue to follow a sideways movement while the RSI (14) signal line moves below 50-level, suggesting more bearish signals.
Join Our Telegram channel to stay up to date on breaking news coverage

