Join Our Telegram channel to stay up to date on breaking news coverage
LTC Price Prediction – July 26
LTC coin stays bearish after the rejection from the strong resistance around $50.75.
LTC/USD Market
Key Levels:
Resistance levels: $50, $52, $54
Support levels: $46, $44, $42
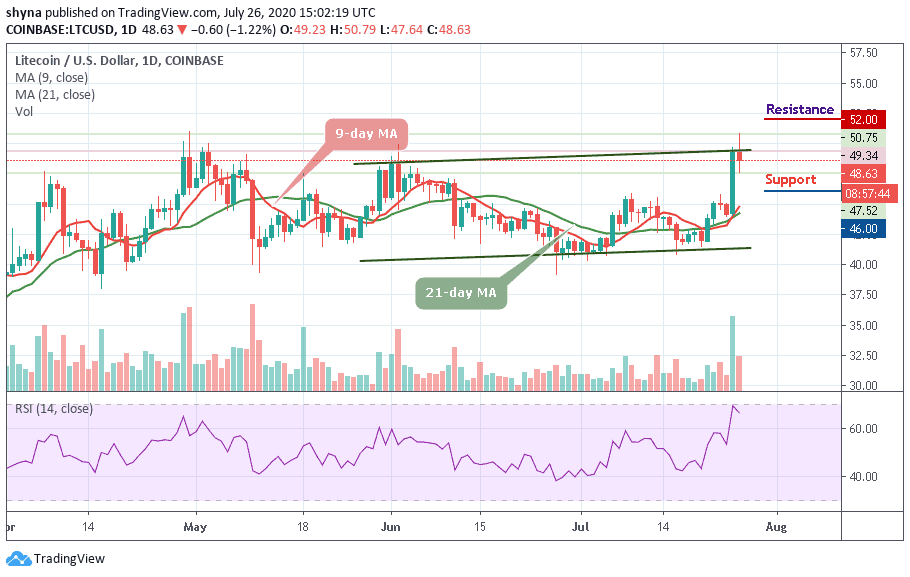
Today, LTC/USD has been looking bearish as the price tested and printed below $50 to touch the low of $47.52 support level. Looking at the technical indicator RSI (14) is making a quick turn back by moving below 70-level. The volume has also picked up as the selling kicked in. Therefore, $48 may now be the main level of support that needs to be watched.
Moreover, LTC/USD started trading today with a price of about $49.35 and touched the daily high at $50.75. The market opened without any sign of moving down before the bears grabbed the price and dragged it below the point where it is currently trading at $48.63. With this fall, the coin might not be able to maintain its effectiveness again.
However, the intraday movement of the coin is quite unstable, but starting at $49, a rebound may likely occur and if the bulls put more effort to push the Litecoin price to cross the upper boundary of the channel. The potential resistances to watch are $52, $54, and $56 while the supports are $46, $44, and $42 levels.
Against Bitcoin, the Litecoin performance has been very low due to a bearish recurring. The pair is already falling towards the 9-day and 21-day moving averages, if the price continues to fall like that, it may likely hit the 4700 SAT support level. Breaking this level could further drag the market to the nearest support levels at 4600 SAT, 4400 SAT, and 4200 SAT.
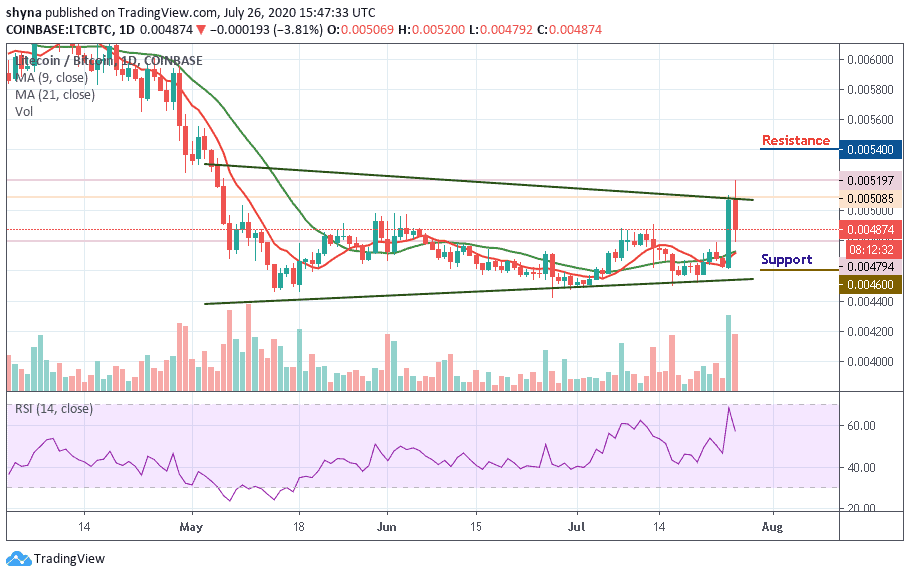
However, as the coin changes hands at 4874 SAT, if the bulls can hold the price tight and push it above the channel, the nearest resistance level may likely be at 5200 SAT respectively. Reaching this level might move it to the potential resistance at 5400 SAT and above. Meanwhile, the RSI (14) is dropping below the 60-level; possible selling pressure is likely if it continues like this.
Join Our Telegram channel to stay up to date on breaking news coverage