Join Our Telegram channel to stay up to date on breaking news coverage
Bitcoin (BTC) Price Prediction – July 26
In the past few days, the Bitcoin price has gained upwards of over 10%, and it all ended today as the coin finally cracked the most anticipated $10,000 level mark.
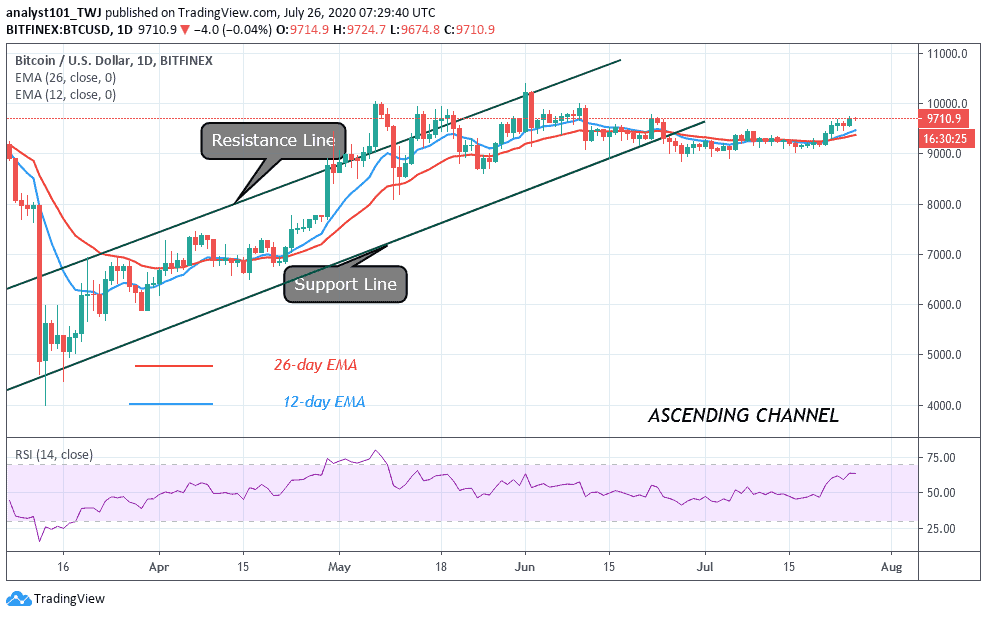
BTC/USD Long-term Trend: Ranging (Daily Chart)
Key levels:
Resistance Levels: $10,500, $10,700, $10,900
Support Levels: $9,200, $9,000, $8,800
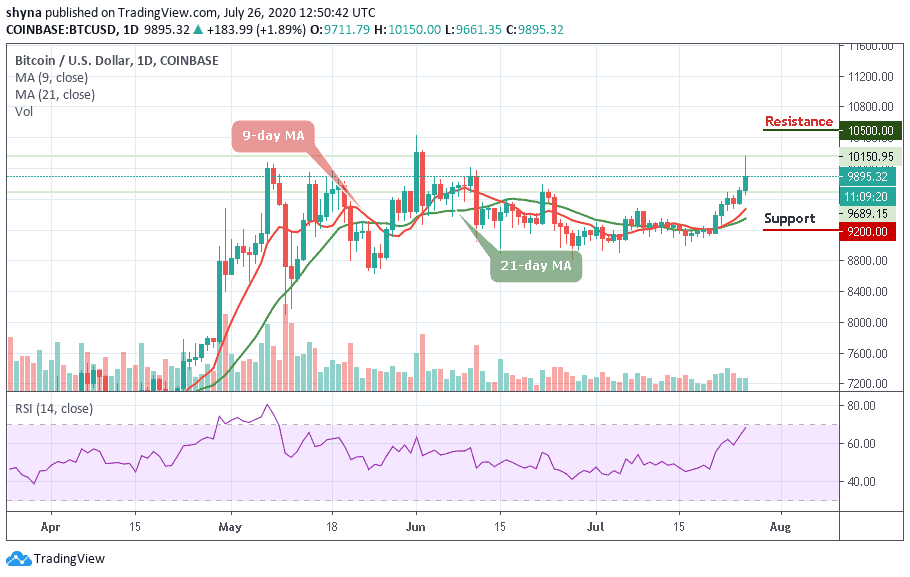
In one of our last analysis, we had mentioned that BTC/USD is getting ready to touch the long-awaited $10,000 within the next few days. From the past few days, the Bitcoin price has been hovering around $9,500 level mark. Today, BTC/USD skyrocketed to $10,150 and dropped back below $10,000 in a matter of minutes. At the time of writing, BTC/USD is changing hands at $9,895 amid short-term bearish bias as the technical indicator RSI (14) moves to cross into the overbought region.
More so, the coin has gained nearly 4% in the recent 24 hours, but further upside may be limited unless $10,000 is regained. Should there be another resistance at $10,000, if the price manages to stay above it, then one can only say that the sideways is officially ended. So, $10,000 is the level in which BTC price wants to get stable so that it can discover the upward drive to the potential resistance levels of $10,500, $10,700, and $10,900.
Meanwhile, the swift decline below $10,000 confirms that this area may be too strong to be taken out at the first attempt. The price may continue the downside correction from an overbought territory with the first support created around $9,800. This barrier is closely followed by $9,750 and the former resistance of $9,700. Any bearish movement below the 9-day and 21-day moving averages could reach the critical supports at $9,200, $9,000, and $8,800.
BTC/USD Medium-Term Trend: Bullish (4H Chart)
The 4-hour chart shows that the bulls are maintaining an upward trend as the RSI (14) remains within the overbought territory. Although the bears are trying to bring down the price, the support levels of $9,700 and below may come into play if the price breaks below the moving averages of 9-day and 21-day.
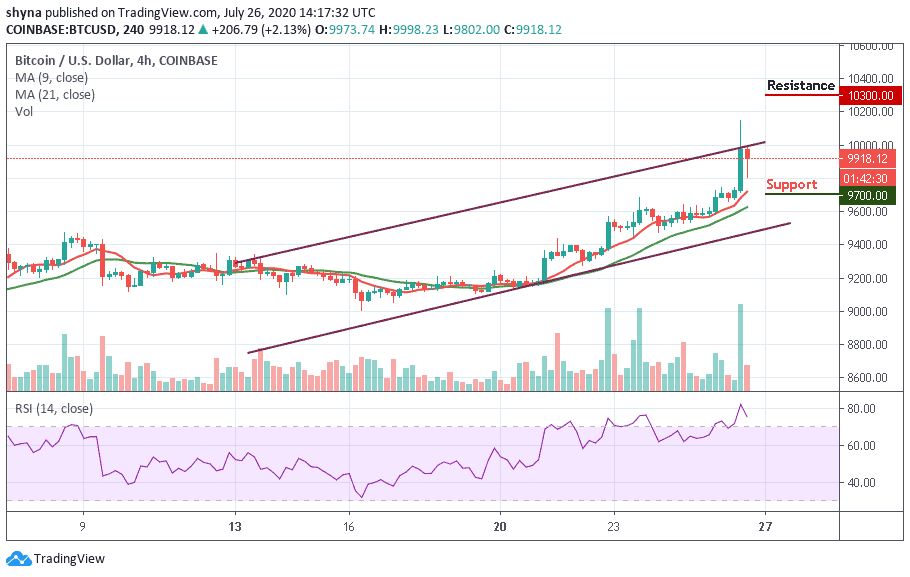
Nevertheless, in as much as the red-line of 9-day moving averages remains above the green-line of the 21-day moving average, the market may continue to obey the upward movement. More so, any bullish cross above the upper line of the ascending channel may likely hit another potential resistance at $10,300 and above.
Join Our Telegram channel to stay up to date on breaking news coverage