Join Our Telegram channel to stay up to date on breaking news coverage
Bitcoin (BTC) Price Prediction – July 26, 2020
Bitcoin bulls have continued to push into the $10,000 overhead resistance zone. Buyers have broken the $9,650 resistance as price rallied above $9,700. The next resistance to retest is the $9,900 price level. This price level will determine whether a breakout will be possible above the $10,000 or not.
Resistance Levels: $10,000, $11, 000, $12,000
Support Levels: $7,000, $6,000, $5,000
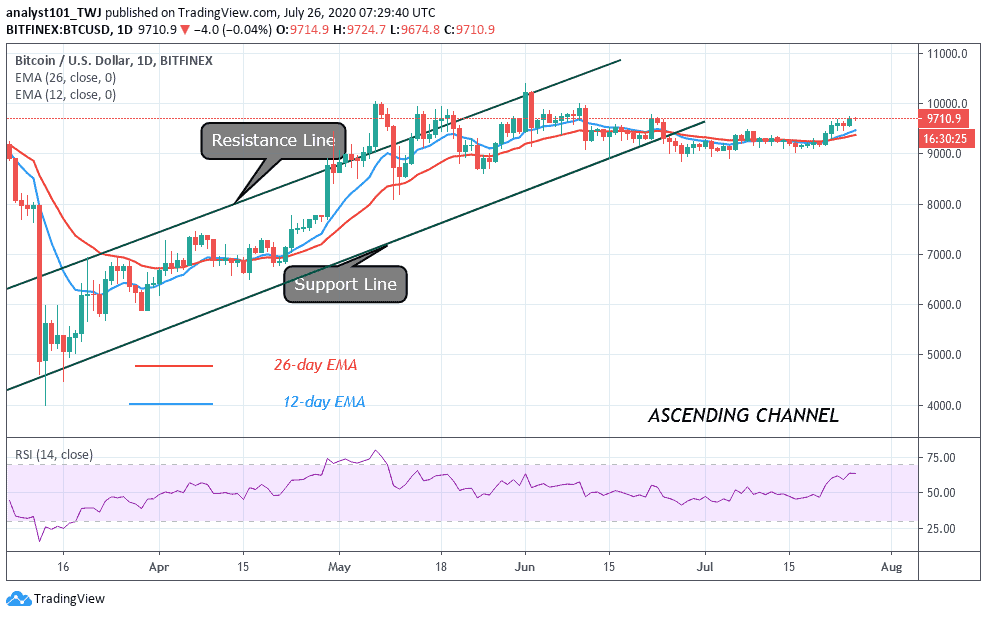
As BTC/USD hovers above $9,700 the market is reaching another overbought region. It is doubtful if price will break the next resistance at $9,900. Nevertheless, if sellers emerge at the overbought region, the coin will be compelled to make a corrective move to the $9,300 support. Thereafter the price will resume a fresh uptrend. That is, the upside range trading will resume as price fluctuates between $9,300 and $9,800 to retest the $10,000 resistance. Alternatively, if the bulls face rejection at the recent high, BTC will make a corrective move to $9,300 support. The king coin will make a further downward move if the $9,200 support cracks.
Assuming, a breakout occurs above $10,000 and the momentum clears the $10,500 resistance, there will be a massive move to the $12,000 price level. In the meantime, the price is fluctuating above $9,700. Bitcoin is trading in the uptrend zone at level 63 of the Relative Strength Index period 14. It indicates that the market will rise in the bullish trend zone.
BTC/USD Medium-term Trend: Bullish (4-Hour Chart)
On the 4 hour chart, Bitcoin reached a high of $9,754 as price broke the resistance at $9,650. However, the upward move is hampered as price is facing resistance at the recent high.
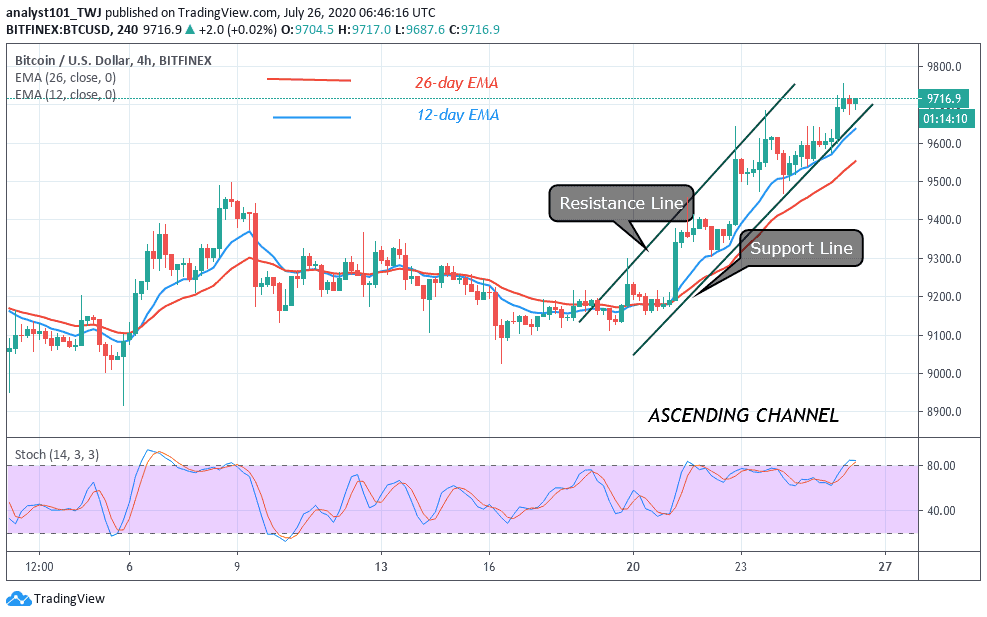
On the downside, if price retraces and breaks below the support line of the ascending channel, the coin will further depreciate to the support of either $9,200 or $9,300. Conversely, if price retraces and finds support above the trend line, the uptrend will resume into the previous highs. Presently, BTC is above 80% range of the stochastic . The market is making a possible upward move in the overbought region.
Join Our Telegram channel to stay up to date on breaking news coverage