Join Our Telegram channel to stay up to date on breaking news coverage
Key Points
- Bitcoin cash price is currently consolidating above the $535 support against the US Dollar.
- There is a key contracting triangle formed with resistance at $570 on the hourly chart of the BCH/USD pair (data feed from Kraken).
- The pair is likely to make the next move either above $570 or below $550 in the near term.
Bitcoin cash price is preparing for the next move against the US Dollar. BCH/USD could rally once again if there is a break above the $570 resistance.
Bitcoin Cash Price Analysis
Yesterday, we saw a solid upward move above the $550 resistance in bitcoin cash price against the US Dollar. The BCH/USD pair traded towards the $600 level and formed a high at $589. Later, there was a minor downside correction and the price traded below $550. There was also a break below the 23.6% Fib retracement level of the last upside from the $473 low to $489 high.
On the downside, the $535 level acted as a decent support and prevented further losses. Moreover, there was no break below the 50% Fib retracement level of the last upside from the $473 low to $489 high. The price is currently consolidating above the $535 support. More importantly, there is a key contracting triangle formed with resistance at $570 on the hourly chart of the BCH/USD pair. If the pair breaks the triangle resistance at $570, it will most likely revisit the $589 high. Above the stated high, the price could test the $600 level, which is a major barrier. On the other hand, a downside break below $550 may well push the price towards the $535 support.
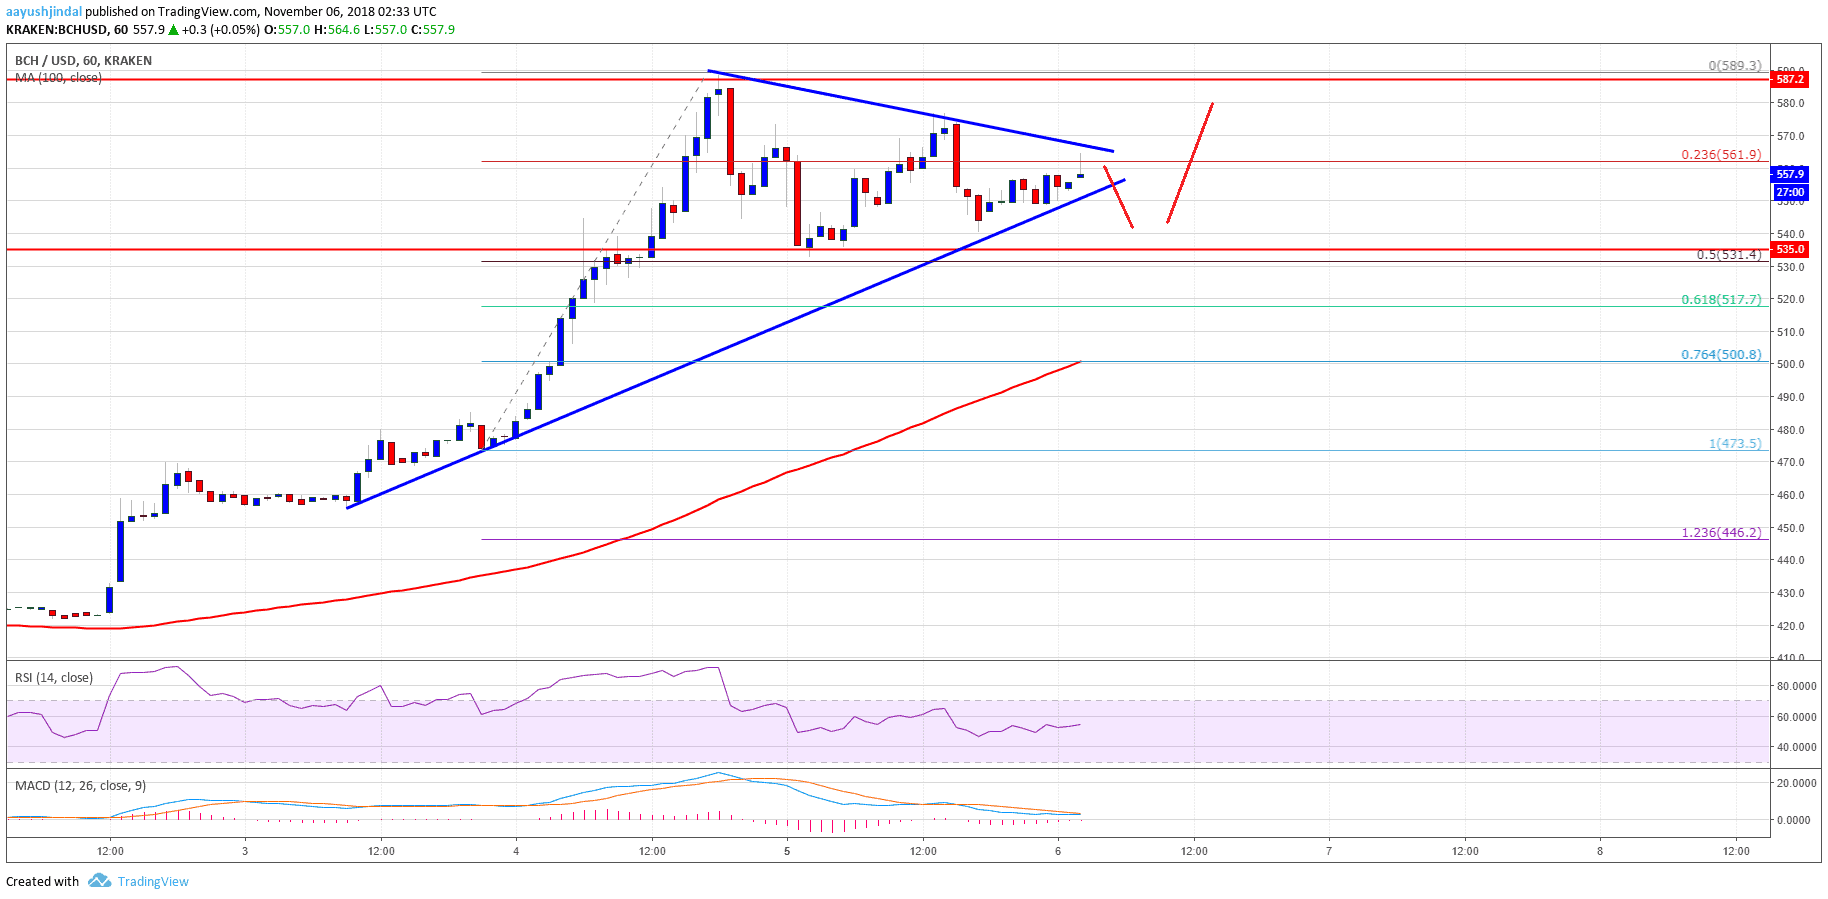
Looking at the chart, BCH price is preparing for the next move and it will either break $570 or move below $550 in the near term.
Looking at the technical indicators:
Hourly MACD – The MACD for BCH/USD is about to move into the bullish zone.
Hourly RSI (Relative Strength Index) – The RSI for BCH/USD is above the 50 level.
Major Support Level – $550
Major Resistance Level – $570
The post Bitcoin Cash Price Analysis: BCH/USD Approaching Next Key Break appeared first on NewsBTC.
Join Our Telegram channel to stay up to date on breaking news coverage