
Join Our Telegram channel to stay up to date on breaking news coverage
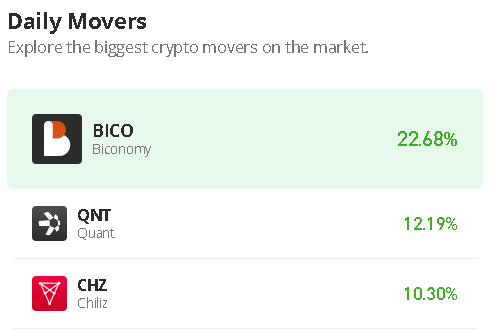
The Biconomy price prediction reveals that BICO is hovering above the moving averages as the coin crosses above the channel.
Biconomy Prediction Statistics Data:
- Biconomy price now – $0.435
- Biconomy market cap – $93.9 million
- Biconomy circulating supply – 209.7 million
- Biconomy total supply – 1 billion
- Biconomy Coinmarketcap ranking – #237
BICO/USD Market
Key Levels:
Resistance levels: $0.600, $0.650, $0.700
Support levels: $0.300, $0.250, $0.200
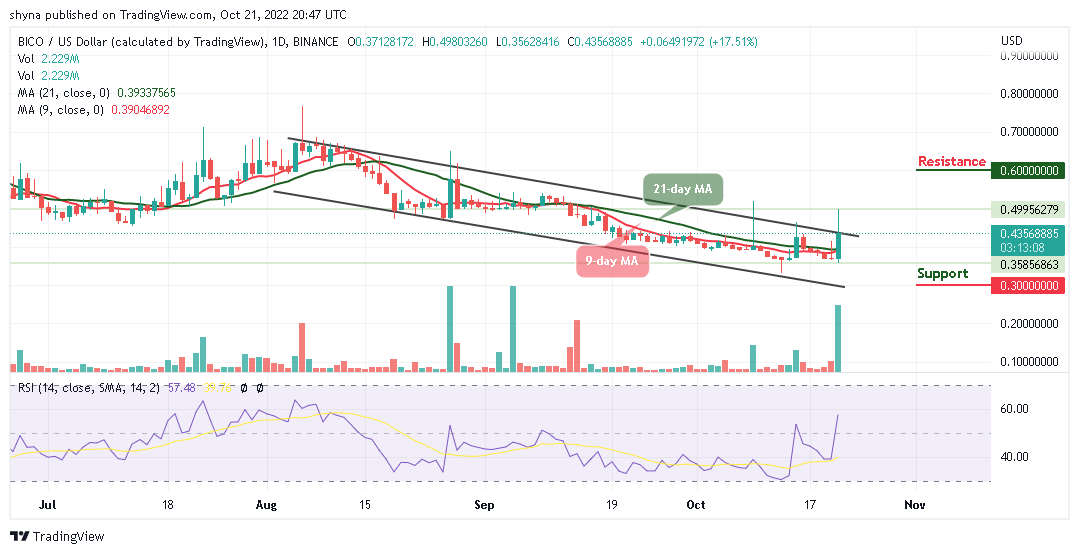
The BICO/USD peaked at $692 today, after which it couldn’t maintain the trend as the price dropped and stayed trading above the 9-day 21-day moving averages. However, the price not reflecting above the upper boundary of the channel ruins the long-term technical picture of the coin. Therefore, the Biconomy price will have to touch the resistance level of $0.550 to increase the buying pressure while the closest resistance expects the coin at $0.490, which could be the daily high.
Biconomy Price Prediction: Biconomy May Expand More
At the time of writing, the Biconomy price is currently hovering above the 9-day and 21-day moving averages but a movement towards the south may likely bring the coin to the support levels of $0.300, $0.250, and $0.200. From above, a sustained movement across the upper boundary of the channel may create momentum for the bulls with the focus to move the market to the next resistance levels of $0.600, $0.650, and $0.700 respectively.
At the time of writing, the technical indicator Relative Strength Index (14) signal line is likely to cross above 60-level, which indicates that BICO/USD may continue to trade bullishly. Meanwhile, looking at the daily chart, the 9-day MA must cross above the 21-day MA for the buyers to concentrate on stirring action to the north.
When compares with BTC, following the trade for the past few days, bulls have shown a great commitment to BICO trading by following the recent positive sign. Furthermore, the current market trend may continue to go up if the buyers can sustain the pressure further.
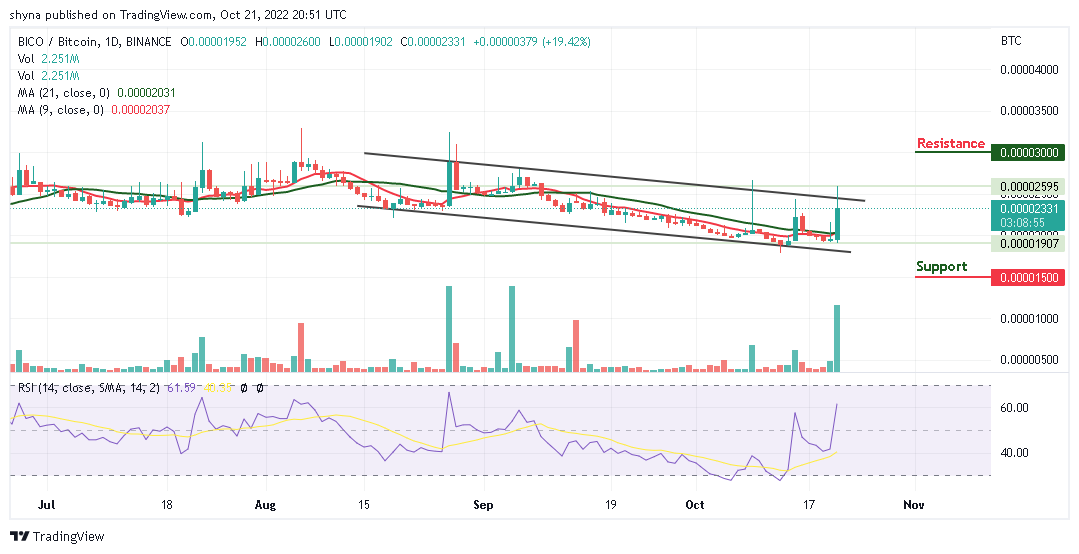
However, if the bulls succeeded in pushing the coin above the upper boundary of the channel, the market price may likely reach the next resistance level of 3000 SAT and above. On the contrary, a retest could allow the coin to go below the 9-day and 21-day moving averages and lower the price to the support level of 1500 SAT and below. However, the technical indicator Relative Strength Index (14) crosses above the 60-level, suggesting additional bullish signals into the market.
Currently, the IMPT token is more than midway through its presale and has thus far experienced dramatic success, having now raised around $6m.
Dash 2 trade is crypto analytics and intelligence platform that provides users with valuable insights to make informed investment decisions when trading crypto. The first platform of its kind, Dash 2 Trade calls itself a “Bloomberg Terminal of Crypto”, offering complete pro-level features to ordinary traders so they can get the most out of the volatility of the crypto space.
Related:
- How to buy D2T token
Join Our Telegram channel to stay up to date on breaking news coverage